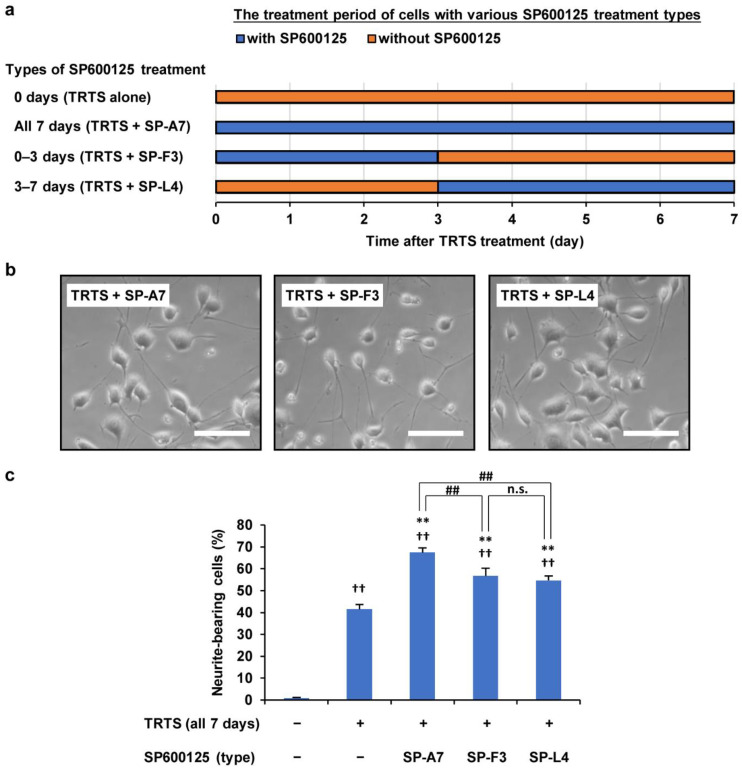
Figure 5.
Effects of various treatment times with 0.5 μM SP600125 on PC12-P1F1 neuritogenesis while undergoing TRTS exposure. (a) Schematic representation of the treatment times of PC12-P1F1 cells with SP600125 in the presence of TRTS. PC12-P1F1 cells were stimulated with SP600125 under TRTS exposure as follows: all 7 days (TRTS + SP-A7), first 3 days (TRTS + SP-F3), and last 4 days (TRTS + SP-L4). (b) Phase-contrast images of PC12-P1F1 cells on day 7. Scale bars: 100 μm. (c) Percentage of neurite-bearing cells on day 7. Cells that did not undergo TRTS or SP600125 treatment were defined as the negative control group. The data represent the means ± standard deviation of three replicates. ## p < 0.01; n.s., not significant; †† p < 0.01 vs. control; ** p < 0.01 vs. TRTS alone.

