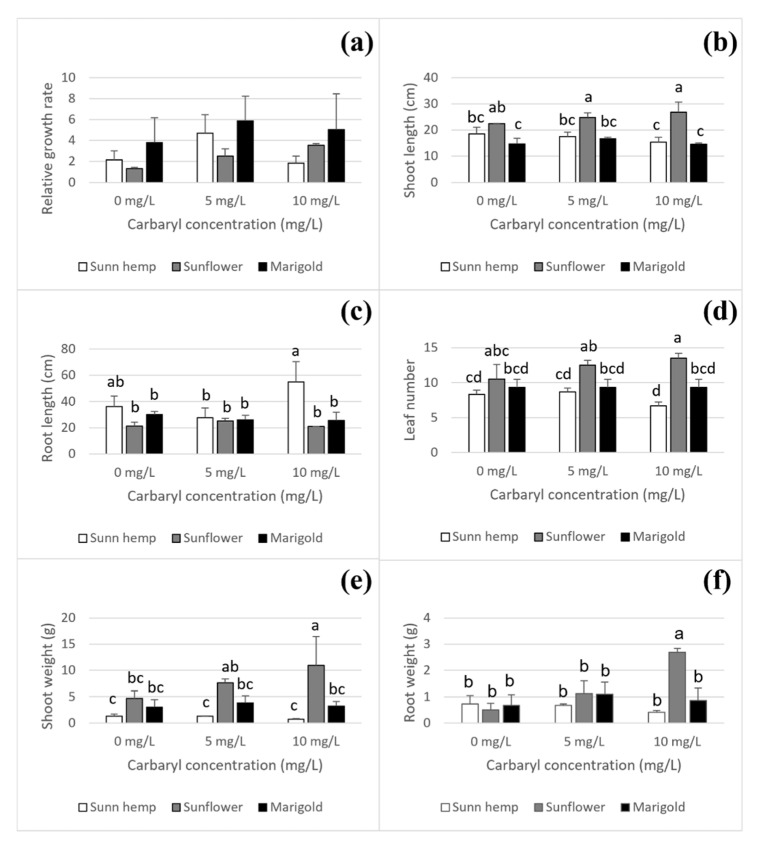
Figure 5.
Effect of carbaryl on plant physiology after 4 days of cultivation for carbaryl treatments at 0, 5 and 10 mg L−1; relative growth rate (a), shoot length (b), root length (c), leaf number (d), shoot weight (e), and root weight (f). Note: a, b, c, and d indicate significant differences based on ANOVA and Tukey’s HSD test. The data shown are mean and SD.

