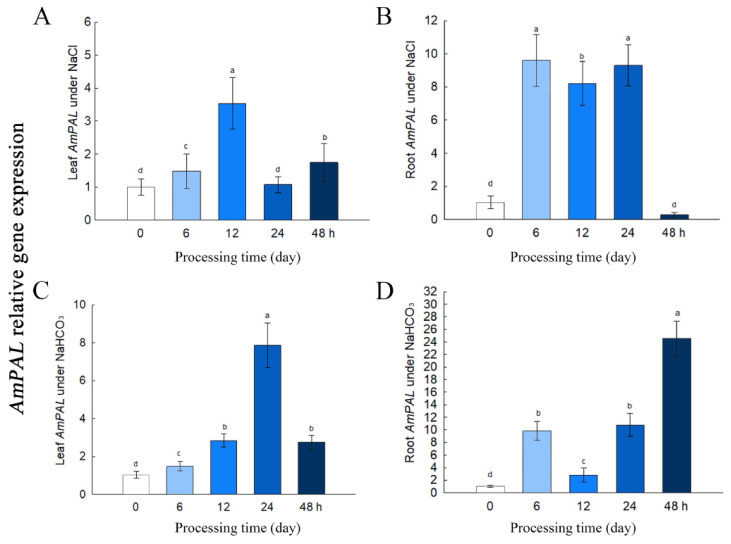
Figure 3.
Gene expression of AmPAL under 150 mM NaCl or 60 mM NaHCO3 for 0, 6, 12, 24, and 48 h. (A) Leaf AmPAL under NaCl. (B) Root AmPAL under NaCl. (C) Leaf AmPAL under NaHCO3. (D) Root AmPAL under NaHCO3. Statistical differences are denoted with letters at p < 0.01. Data represent mean ±SD from three biological replicates.

