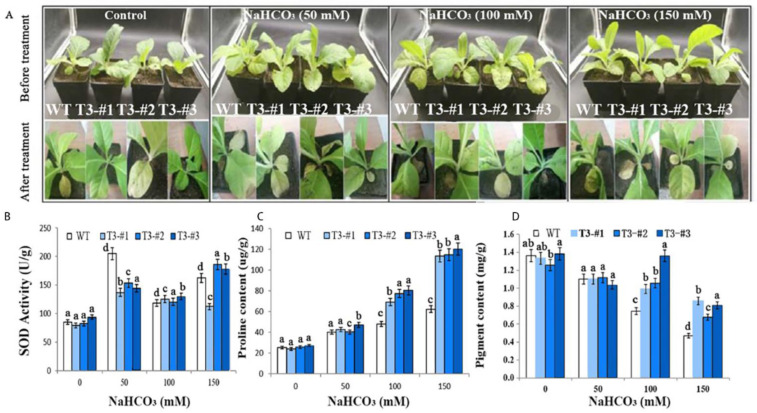
Figure 7.

Enhanced alkaline tolerance in N. tabacum overexpressing AmPAL. (A) Plant phenotypes. The upper and lower panels indicated plants before and after treatment, respectively. One control and three NaHCO3 treatment groups (50, 100, and 150 mM, respectively) were included. For each group, one WT and three transgenic plants (#1–3) were shown. (B–D): quantification of SOD, proline, and chlorophyll, respectively. Marking: The letters on the bar chart are marked for significance analysis. Where there is one same marking letter, the difference is not significant; where there is different marking letters, the difference is significant. The more different letters are, the more significant they are.
