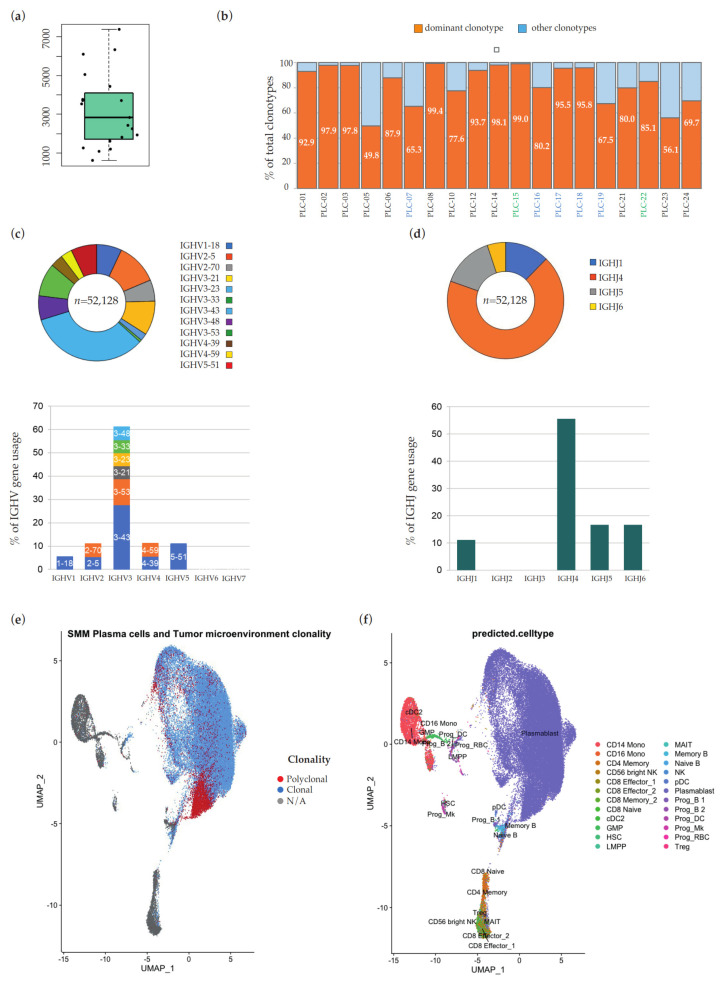
Figure 1.
(a) Distribution of the number of barcodes estimated to be associated with cells that express targeted V(D)J transcripts in the 19 patients’ samples. (b) Percentage of barcodes associated with the dominant clonotype and with all other clonotypes, respectively, in the 19 patients’ samples. On the x-axis, IDs of MGUS samples are in blue, IDs of SMM samples are in black and IDs of MM samples are in green. VH (c) and JH (d) gene usage in 18/19 MM samples with clonal heavy chain rearrangements. The histograms show the sample-level rate of use of each IgH variable region gene family on total of clonal rearrangements. Within each V-family, discrete bands represent each of the individual genes, as indicated. Above each histogram, the representativeness of relative IGH genes/families is plotted at single-cell-level, as number of associated cellular barcodes. (e,f) UMAP dimension reduction of all the barcodes sequenced from samples obtained after CD138-based magnetic beads positive selection. In (e), light blue dots represent barcodes associated with the dominant clonotype of each sample, red dots barcodes associated with other rearrangements, and grey dots barcodes with unrearranged Ig heavy and light chain loci. In (f), dots are color-coded according to transcriptome-based cell type assignment, as indicated in the legend.

