Figure 2.
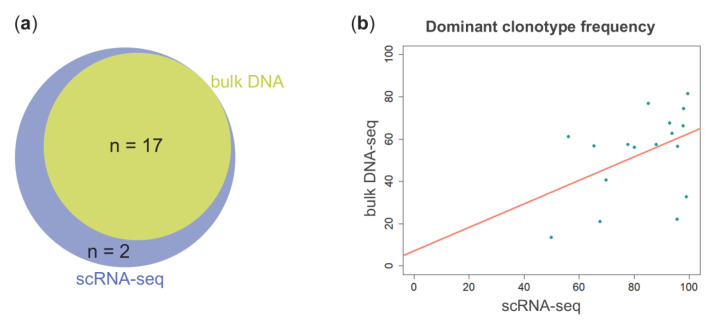
(a) Venn diagram showing the number of unique and shared clonotypes between scRNA-seq (blue circle) and bulk DNA (yellow circle) analyses. (b) Scatterplot of the percentage frequencies of the 17 dominant clonotypes in (a) as determined by scRNA-seq (x axis) and bulk DNA-seq (y axis) analyses.

