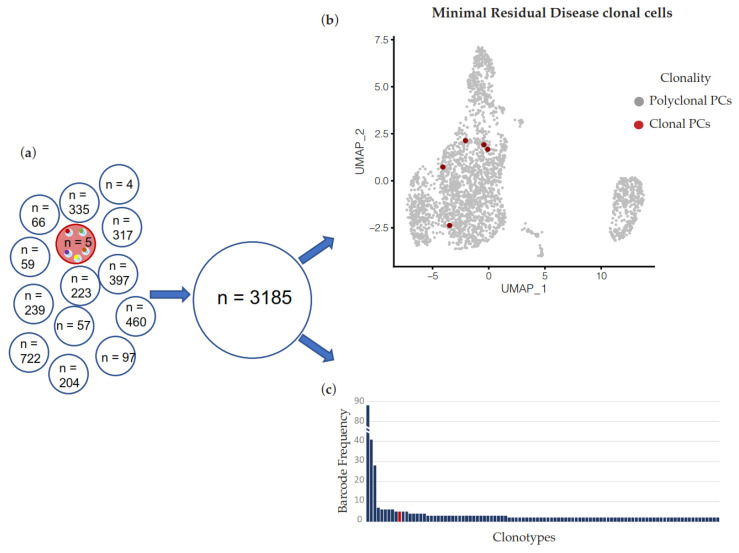
Figure 4.
(a) In silico dilution of reads from 5 barcodes associated with the dominant clonotype of patient’s sample PLC-10 (red) into reads from 3180 barcodes of 13 different samples. (b) UMAP dimension reduction of the simulated sample. Red dots represent barcodes associated with PLC-10-specific V(D)J rearrangement. (c) Bar plot of clonotypes’ abundance in the virtual fastq file generated in (a) and analyzed by Loupe V(D)J Browser. Clonotypes after the 100th rank according to the barcode frequency are not plotted. The red bar represents the clonotype made up of the five barcodes sharing the myeloma-specific V(D)J rearrangement of PLC-10. The presence of the top-ranked clonotypes displayed at the left of the red bar is dependent on the procedure followed for the generation of the virtual sample, and is compatible with the composition of the V(D)J repertoire observable in a normal sample [17].

