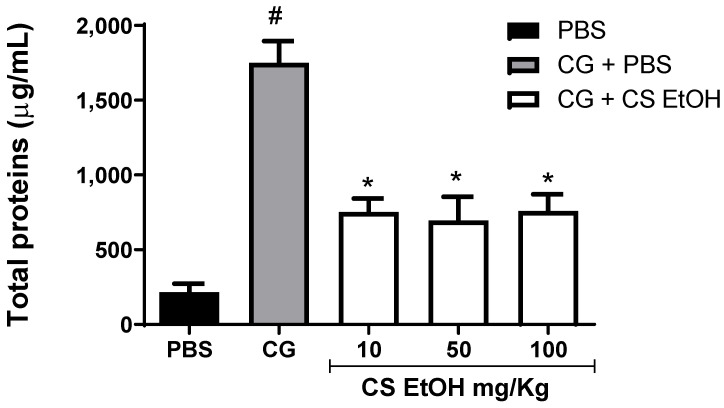
Figure 5.
Quantification of total proteins in the air pouch. The air pouches were inoculated with PBS (0.5 mL PBS/pouch) or carrageenan 1% (CG). After 1 h, the treatment was applied (CS EtOH 10 or 50 or 100 mg/kg/0.5 mL/pouch) or PBS. The dosage of total proteins was performed after 24 h of treatment. The results were expressed as mean ± SEM (n = 4 to 8). The statistical analysis was realized using two-way ANOVA followed by Tukey’s post-hoc test. Significantly different p < 0.05 * vs. CG group and # vs. PBS group.

