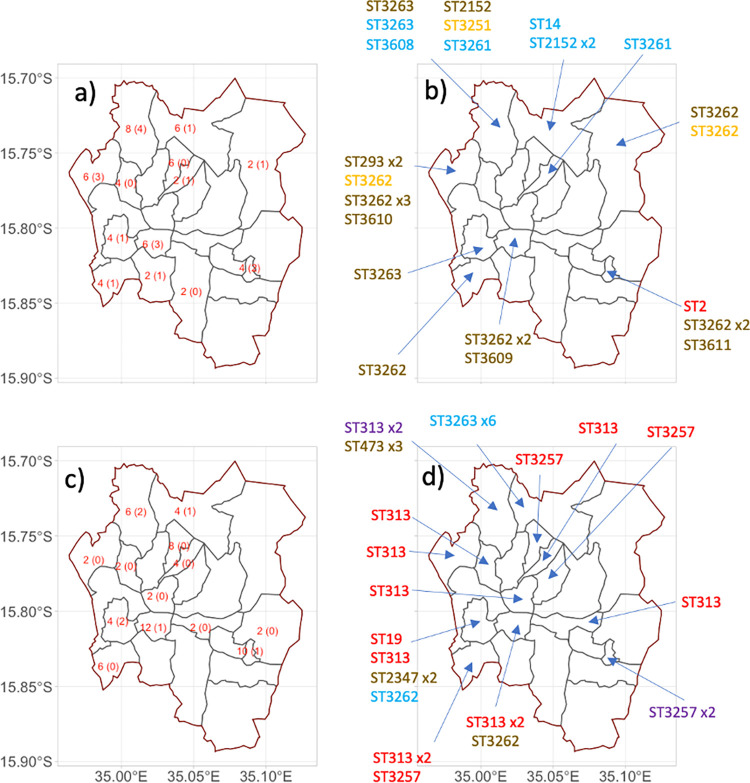
Fig 1.
The geographic location of samples in this study a) & b) are for typhoid fever case and control households, while c) and d) are for iNTS case and control households. a) and c) indicate the number of households (case + control) that were sampled from each area, in parentheses is the number of households where Salmonella was isolated (not including the index case isolate). b) and d) indicated the sequence type of all the Salmonella isolated from that location, including the index case isolates. STs are coloured by the type of sample they were isolated from. Red is invasive Salmonella, blue is a household member of an invasive Salmonella case, purple is in both invasive Salmonella and a household member, brown is the environment and orange is animal. Map shapefile obtained from https://data.humdata.org/dataset/20eb8e5b-134d-41d8-a56f-4f358f7faf16/resource/50f185b1-b028-4787-a591-80c8db81cfed/download/mwi_adm_nso_20181016_shp.zip. The map shape files are licenced under the Creative Commons Attribution for Intergovernmental Organisations licence - https://creativecommons.org/licenses/by/3.0/igo/legalcode.

