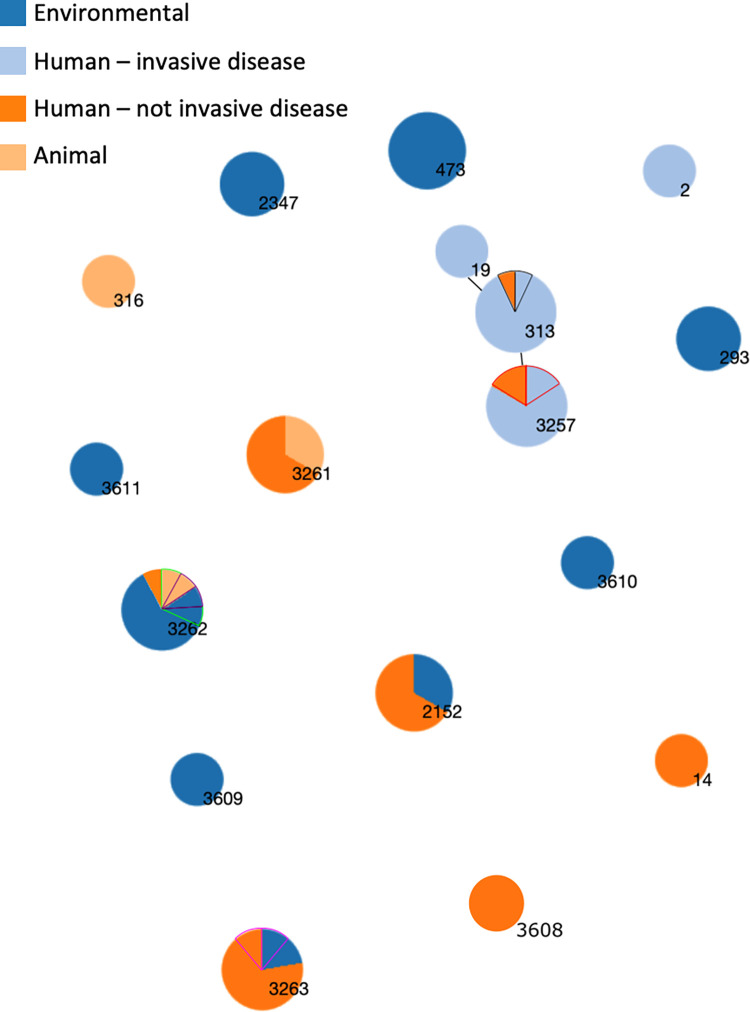
Fig 2. Minimum spanning tree based on seven MLST genes showing the genetic similarity between different niches–the only non-clinical niche where STs associated with human invasive disease were present was the gut of household contacts.
Each circle represents a sequence type, the size of the circle is proportional to the number of isolates of that ST. STs that vary by one locus are joined by a black bar. Two invasive disease index isolates had a matched isolate from a healthy human sample of the same ST from the same household. These isolates are indicated by black and red outlines. In cases where there were multiple isolates of the same sequence type isolated from the same household, these “slices” of pie have had a border of the same colour. I.e. There were two isolates of ST3257 isolated from the same household, one from human invasive disease, and one from human nont invasive disease. Therefore, on the ST3257 pie, one slice of orange (not-invasive) and one slice of light blue (invasive) have been bordered in red.

