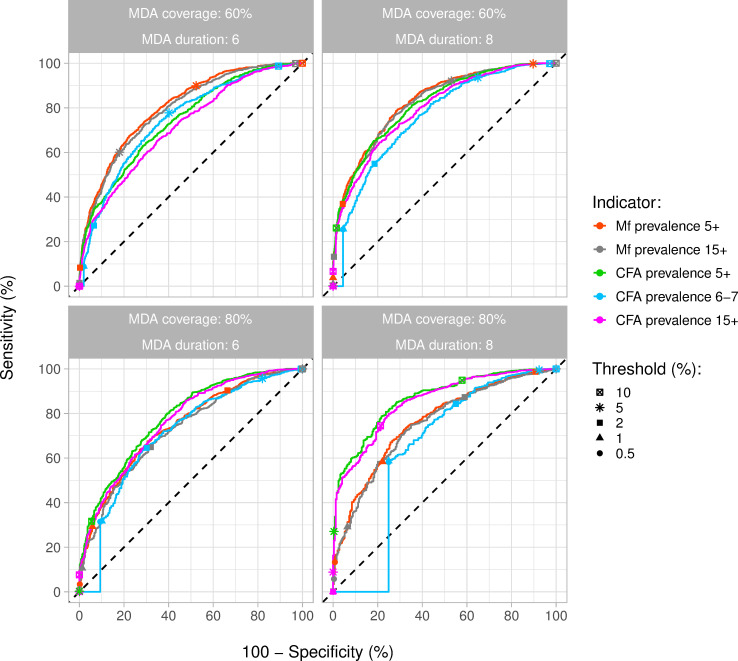
Fig 3. Receiver-operator characteristic (ROC) curves for predicting the eventual occurrence of elimination of transmission under different MDA scenarios, based on the simulated microfilaraemia (Mf) or circulating filarial antigenaemia (CFA) prevalence 1 year after the last treatment round.
Different lines show the predictive performance of the Mf and CFA prevalence assessed in all people aged 5 or 15 years and above (Mf: red and grey; CFA: green and pink) and the CFA prevalence in all 6-7-year-old children (blue). Sensitivity is the percentage of simulation runs ending in elimination that are correctly identified based on Mf or CFA prevalence below a range of thresholds (see legend). Similarly, 100%-specificity is the percentage of simulation runs that is falsely classified as having achieved elimination, out of all runs that did not result in elimination, resulting in premature stopping of MDA. The optimal situation is in the upper left corner of the panels (100% sensitivity and 100% specificity). Results are based on 2000 simulations per scenario, with baseline Mf prevalence varying between 20% and 40%.

