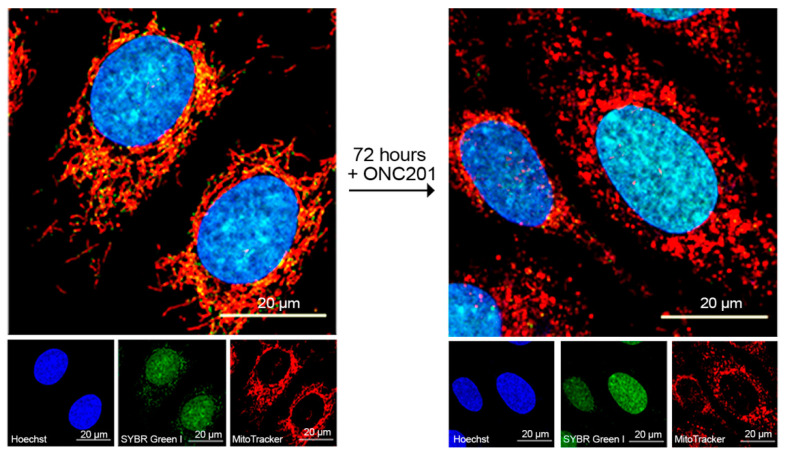
Figure 2.
Effect of ONC201 on mitochondrial morphology and mtDNA content of BT474 cells. Confocal fluorescent images of BT474 before (left panel) and after exposure to single-dose 10 µM ONC201 for 72 h (right panel). Cells were loaded with Hoechst 33342 (2 µg/mL), SYBR Green I (1:200,000 dilution), and MitoTracker Deep Red (150 nM) in HBSS buffer for 30 min at 37 °C. The small panels show individual images of nuclei (blue, Hoechst 33342), mitochondrial nucleoids and nuclear DNA (green, SYBR Green 1), and mitochondria (red, Mito Tracker Deep Red).

