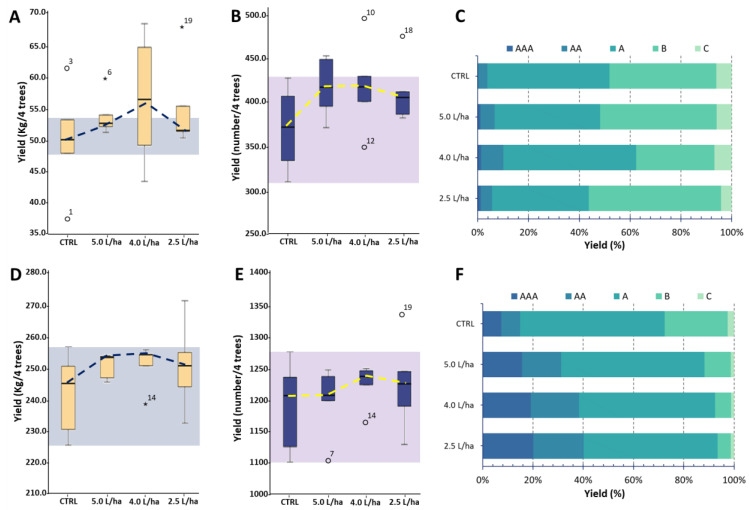
Figure 1.
Agronomic yield data recorded for “Sugar Time” (A–C) and “West Rose” (D–F) varieties after treatment with different biostimulant dosages (5.0, 4.0 or 2.5 L/ha) or with water only. In the different panels, CTRL identifies samples harvested from trees treated with water only. (A,D) The production weight per four trees; (B,E) the number of produced fruits per four trees. Within each box, the horizontal, black lines indicate median values, while the boxes extend from the 25th to the 75th percentile of the distribution of the values in each group. Moreover, the extended vertical lines indicate standard deviations. The dotted lines represent the treatment trend, plotted considering the median value for each sample. Finally, the colored background reports the control values within which a significance of the data cannot be recorded. (C,F) The distribution of the fruit size (AAA, AA, A, B or C) in relation to the total production yield.

