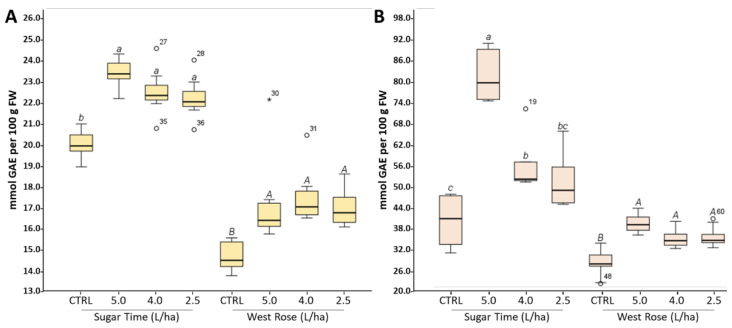
Figure 2.
Total polyphenol content (TPC) measured in the pulp (A) or peel (B) of peaches harvested from trees treated with different dosages of biostimulant (5.0, 4.0 or 2.5 L/ha) or with water alone. In the different panels, CTRL identifies samples harvested from trees treated with water only. Values are expressed as mmol of gallic acid equivalent (GAE) per 100 g of fresh weight (FW). Within each box, the horizontal, black lines indicate median values, while the boxes extend from the 25th to the 75th percentile of the distribution of the values in each group. Moreover, the extended vertical lines indicate standard deviations. For each panel, within the same variety (“Sugar Time” or “West Rose”) the different lowercase (var. Sugar Time) or uppercase (var. West Rose) letters indicate significant differences at p ≤ 0.05, as measured by Tukey’s multiple interval test. The letter “a” indicates the highest value.

