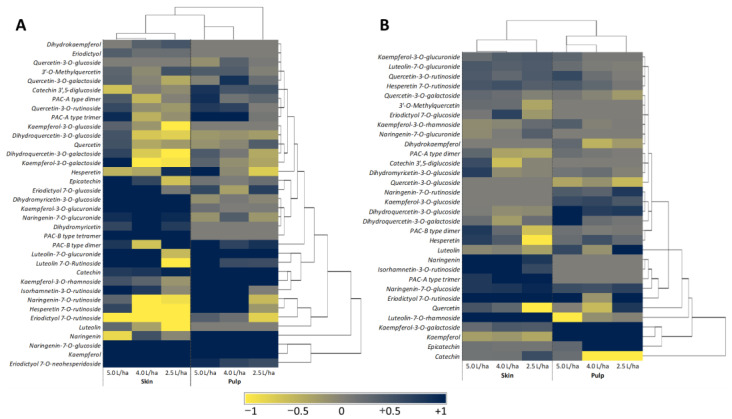
Figure 5.
Heat map coupled to a heriodictal analysis showing the relative content of phytochemical compounds identified and quantified in the peel and pulp of peaches harvested from Prunus persica trees var. “Sugar Time” (A) or “West Rose” (B) treated with different concentrations (2.5, 4.0 or 5.0 L/ha) of biostimulant. The relative content was calculated as ln(treated samples/water-only samples), using the values reported in Table 2 and Table 3. The different colors refer to the increase (blue) or decrease (yellow) in the respective molecule. The dendrogram represents the linkage clustering among the treatments (top) or phytochemical compounds (right) using Euclidean distance measures.

