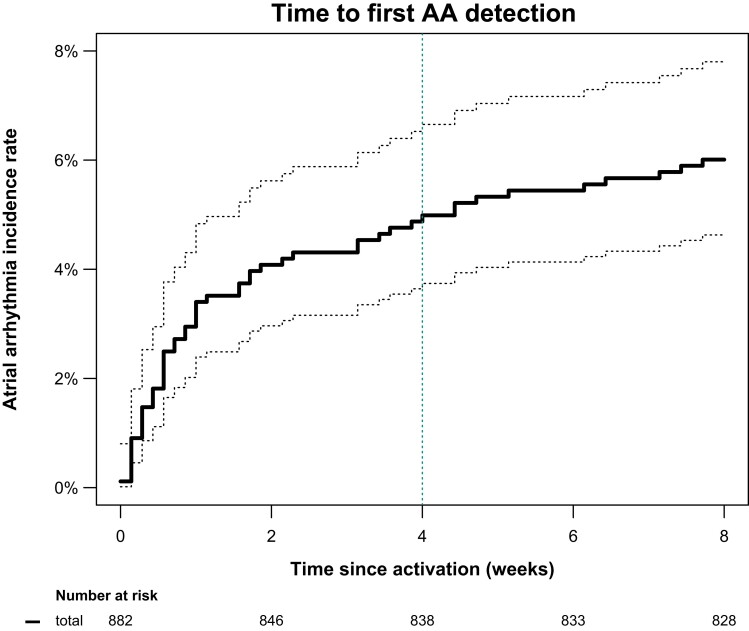
Figure 2.
Detection of atrial arrhythmias over time in the study population. The bold continuous black line shows the Kaplan-Meier estimated cumulative event rate with corresponding 95% confidence interval (dotted black lines). The dotted green vertical line identifies the time point of the primary outcome, detection of atrial arrhythmias within 28 days of screening. Screening beyond this time point identified only a few additional cases.

