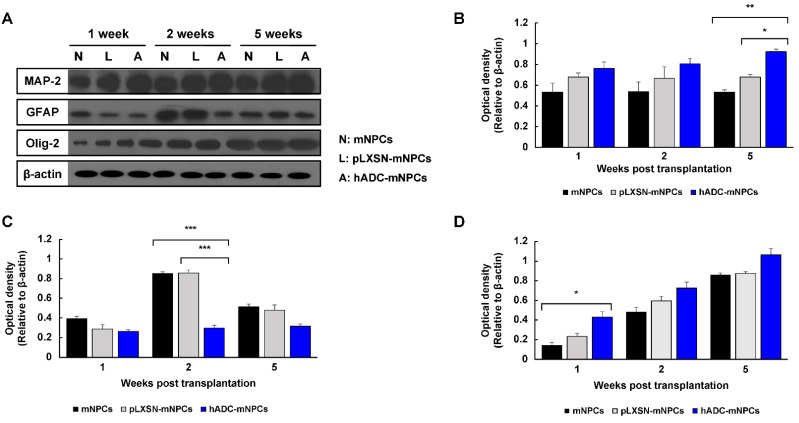
Figure 3.
Western blotting of MAP-2, GFAP, Olig-2, and β-actin from T8, T9 (lesion area), and T10 at 1, 2, and 5 weeks after cell transplantation. (A) Representative Western blots of MAP-2, GFAP, Olg-2, and β-actin. (B) Quantification of MAP-2, showing that hADC-mNPC mice had significantly higher expression than pLXSN-mNPC or mNPC mice at 5 weeks post-transplantation. (C) Quantification of GFAP, showing a significant decrease in the hADC-mNPC group compared with the pLXSN-mNPC and mNPC groups at 2 weeks post-transplantation. (D) Quantification of Olig-2, showing a significant increase in the hADC-mNPC group compared with the pLXSN-mNPC and mNPC groups at 1 week post-transplantation. Data are presented as the mean ± SEM. (n = 5 per sample, * p < 0.05, ** p < 0.01, *** p < 0.001).

