. 2022 Mar 4;3(3):208–219. doi: 10.1158/2643-3230.BCD-21-0092

Figure 3.

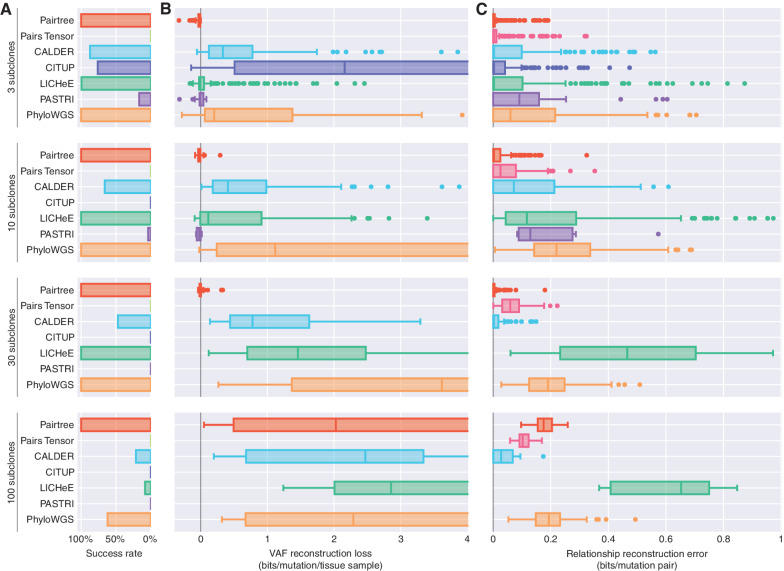
Figure 3. Benchmark performance on 576 simulated datasets. Simulations are grouped by number of subclones (rows). A, Bar plots show each method's success rate in the group. Successes are reconstruction problems for which the method produced at least one tree in 24 hours (wall-clock time) and did not crash. B, Boxplots show distributions of VAF reconstruction losses for a method on a problem group. Scores reflect only datasets where a method ran successfully. VAF reconstruction loss is the decrease in average, per-mutation log likelihood of VAF data using subclonal frequencies assigned by the method, when compared with the true frequencies used to generate the data. Negative loss indicates better VAF reconstructions than true trees, while high loss indicates inaccurate tree structures. Mid-lines in box plots indicate medians. Plots are truncated at four bits. C, Boxplots show distributions of relationship reconstruction error in each group for each method's successful runs. Relationship reconstruction error is measured as the average Jensen–Shannon divergence per subclone pair between the true distributions over pairwise relations, and empirical distributions computed from the trees output by a method. Errors can range between zero bits (perfect match) and one bit (complete mismatch).

Benchmark performance on 576 simulated datasets. Simulations are grouped by number of subclones (rows). A, Bar plots show each method's success rate in the group. Successes are reconstruction problems for which the method produced at least one tree in 24 hours (wall-clock time) and did not crash. B, Boxplots show distributions of VAF reconstruction losses for a method on a problem group. Scores reflect only datasets where a method ran successfully. VAF reconstruction loss is the decrease in average, per-mutation log likelihood of VAF data using subclonal frequencies assigned by the method, when compared with the true frequencies used to generate the data. Negative loss indicates better VAF reconstructions than true trees, while high loss indicates inaccurate tree structures. Midlines in box plots indicate medians. Plots are truncated at four bits. C, Boxplots show distributions of relationship reconstruction error in each group for each method's successful runs. Relationship reconstruction error is measured as the average Jensen–Shannon divergence per subclone pair between the true distributions over pairwise relations, and empirical distributions computed from the trees output by a method. Errors can range between zero bits (perfect match) and one bit (complete mismatch).