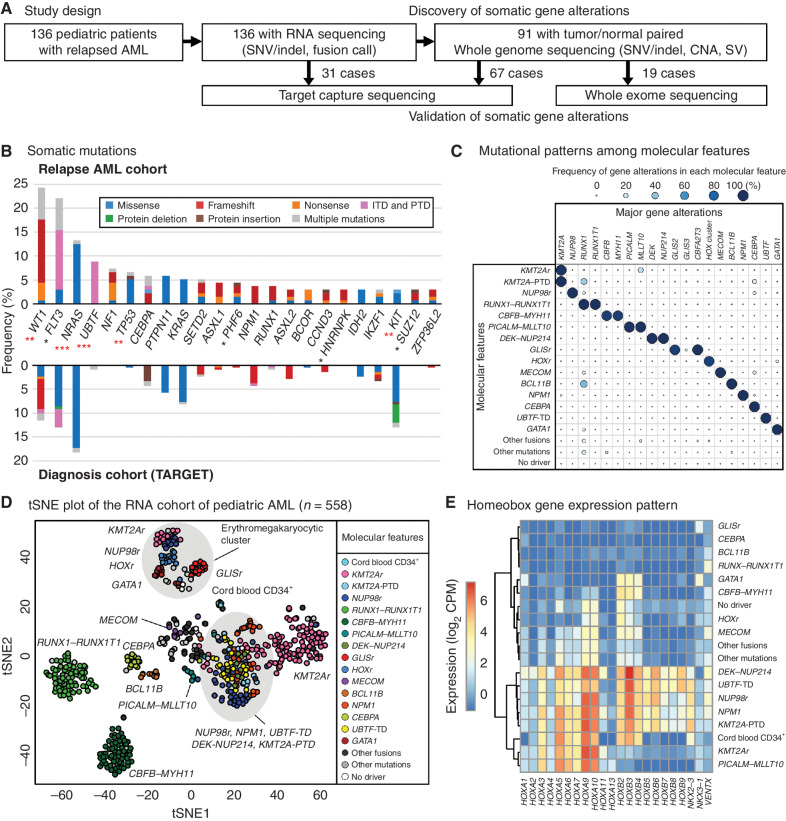
Figure 1.
Molecular landscape of relapsed pediatric acute myeloid leukemia (AML). A, The study design. Tumor samples from 136 pediatric patients with relapsed AML were subjected to RNA-seq followed by WGS, WES, and TCS when patient samples were available. B, The ratio of patients with recurrent somatic coding mutations in the relapsed AML cohort. The color in each bar represents the type of mutation. Asterisks denote the significance of the difference with the TARGET cohort calculated by Fisher exact test (*, P < 0.05; **, P < 0.01; ***, P < 0.001) and red asterisks denote q < 0.05 after adjustment for multiple testing by the Benjamini-Hochberg method. C, Mutually exclusive gene alteration patterns. Each dot's color and size denote the ratio of patients with the gene alteration. D, t-Distributed Stochastic Neighbor Embedding (tSNE) of expression profiles of the pediatric AML cohort (n = 558) performed with the top 250 most variably expressed genes. The color of each dot denotes the molecular feature of the sample. E, An expression heat map of representative homeobox genes in each molecular feature. The colors denote averaged log2 CPM (counts per million) within each molecular feature.

