. 2022 Feb 17;3(3):194–207. doi: 10.1158/2643-3230.BCD-21-0160

Figure 3.

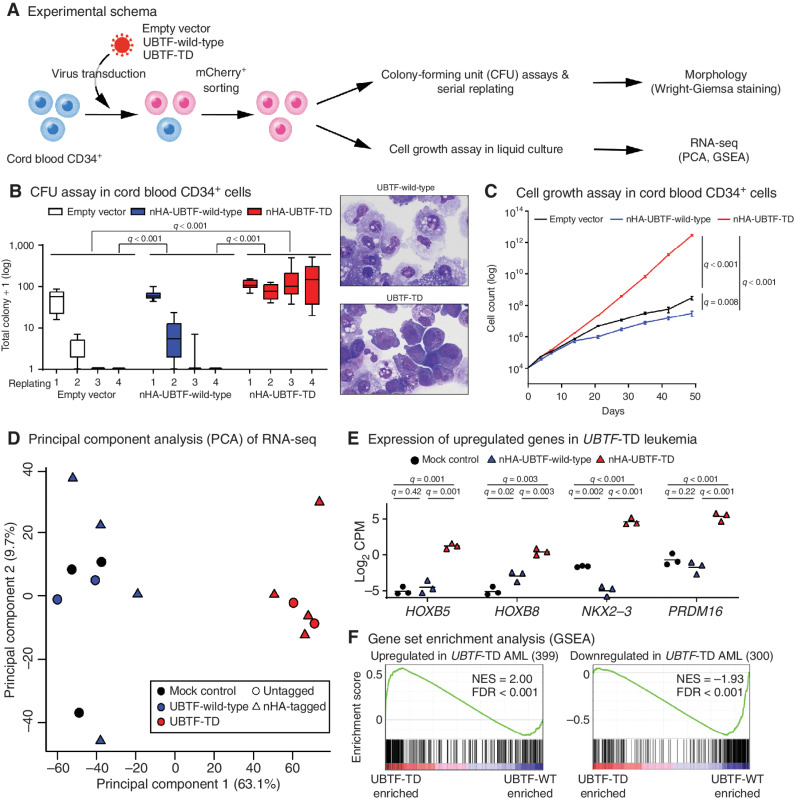
Figure 3. In vitro modeling of UBTF-TD. A, Experimental design of in vitro modeling of UBTF-TD in cord blood (CB) CD34+ cells. B, The effects of UBTF-wild-type and UBTF-TD overexpression in colony-forming potential of cord blood CD34+ cells. Boxplots of logged colony count from technical replicates (Empty vector: n = 7, UBTF-wild-type: n = 12, UBTF-TD: n = 12) from five independent experiments are shown. A box represents quartiles, and whiskers represents max and minimal values. Statistical significances were calculated by ANOVA test followed by pairwise comparisons and adjustment with Tukey method (left). Wright-Giemsa staining of cells derived from the second replating. Both images are at equal magnification (60×; right). C, The effects of UBTF-wild-type and UBTF-TD overexpression on cell growth of CD34+ cord blood in liquid culture. Experimental design and error bars are the same in Fig. 3B. Statistical significances were calculated at day 49 by Student t test followed by adjustment for multiple testing by the Benjamini-Hochberg method. D, Principal Component Analysis (PCA) of transcriptional profiles of transduced cord blood CD34+ cells at day 32 (Empty vector: n = 3, UBTF-wild-type: n = 6, UBTF-TD: n = 6). E, Expression of representative genes upregulated in UBTF-TD AMLs. Bars denote mean from biological triplicates from which data for all conditions were available. Statistical significances were calculated as in Fig. 3C. F, Gene Set Enrichment Analysis (GSEA) between nHA-UBTF-WT (n = 3) and nHA-UBTF-TD (n = 3) transduced conditions using gene sets identified in patient samples (Supplementary Table S21).

In vitro modeling of UBTF-TD. A, Experimental design of in vitro modeling of UBTF-TD in cord blood (CB) CD34+ cells. B, The effects of UBTF-wild-type and UBTF-TD overexpression in colony-forming potential of cord blood CD34+ cells. Boxplots of logged colony count from technical replicates (Empty vector: n = 7, UBTF-wild-type: n = 12, UBTF-TD: n = 12) from five independent experiments are shown. A box represents quartiles, and whiskers represents max and minimal values. Statistical significances were calculated by ANOVA test followed by pairwise comparisons and adjustment with Tukey method (left). Wright-Giemsa staining of cells derived from the second replating. Both images are at equal magnification (60×; right). C, The effects of UBTF-wild-type and UBTF-TD overexpression on cell growth of CD34+ cord blood in liquid culture. Experimental design and error bars are the same in Fig. 3B. Statistical significances were calculated at day 49 by Student t test followed by adjustment for multiple testing by the Benjamini-Hochberg method. D, Principal Component Analysis (PCA) of transcriptional profiles of transduced cord blood CD34+ cells at day 32 (Empty vector: n = 3, UBTF-wild-type: n = 6, UBTF-TD: n = 6). E, Expression of representative genes upregulated in UBTF-TD AMLs. Bars denote mean from biological triplicates from which data for all conditions were available. Statistical significances were calculated as in Fig. 3C. F, Gene Set Enrichment Analysis (GSEA) between nHA-UBTF-WT (n = 3) and nHA-UBTF-TD (n = 3) transduced conditions using gene sets identified in patient samples (Supplementary Table S21).