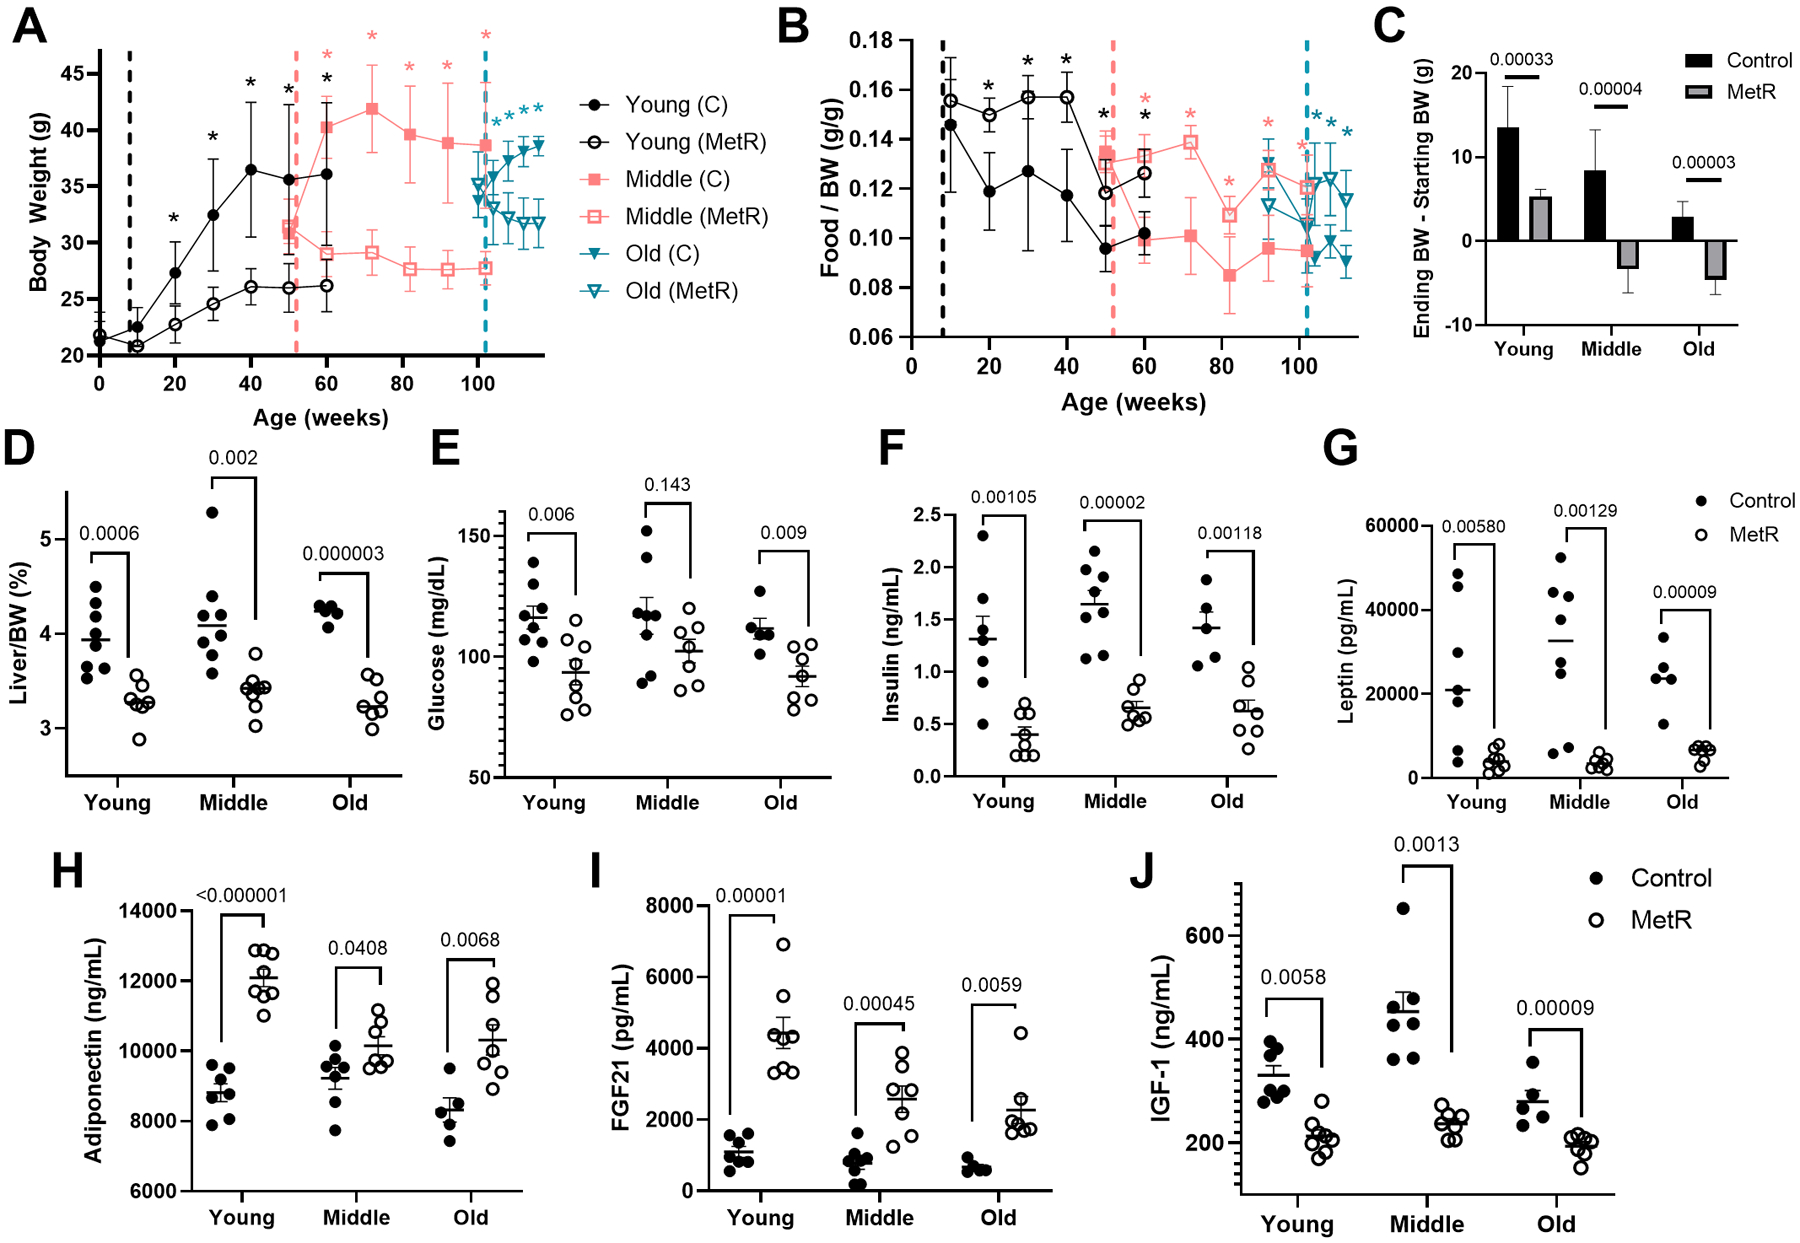
Figure 1. Dietary methionine restriction promotes metabolic health at all ages.

A) Body weights of C57BL/6J male mice fed a control or MetR diet over a 52 (young and middle aged groups n=8/diet/age) or 15 week period (old group, n=5 control and n=8 MetR). Significant comparisons are depicted with asterisks, color corresponds to age group. B) Food consumption expressed as grams of food consumed / grams of body weight, indicating reduction in body weight is not a direct response to decreased caloric intake. C) Change in body weight over the course of the dietary treatment is shown. D) Liver weight divided by body weight, represented as a percentage. Comparisons of endpoint levels of glucose (E), insulin ng/mL (F) leptin, pg/mL (G), adiponectin, ng/mL (H), fibroblast growth factor – 21 (FGF21), pg/mL (I), and insulin-like growth factor (IGF1), ng/mL (J). Graphed are means ± SEM, and differences evaluated by students t test (p values indicated).
