
Figure 4.
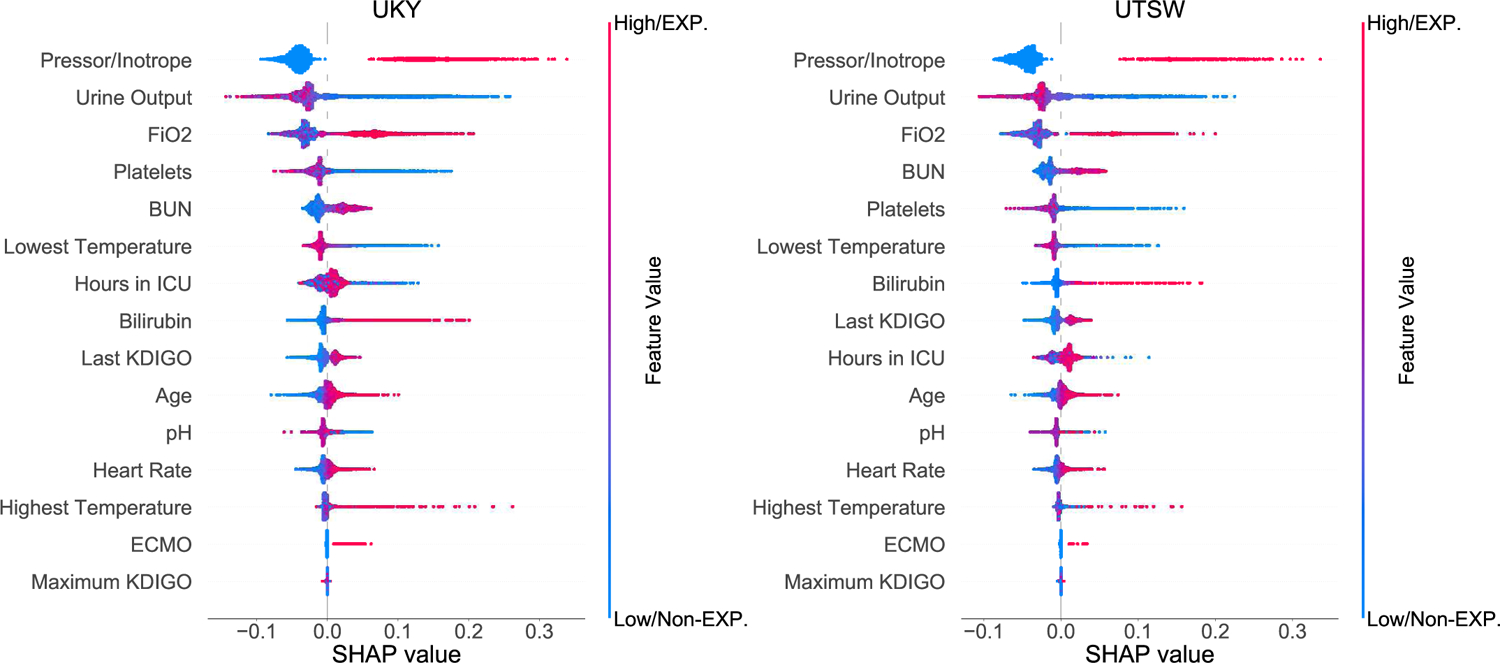
SHapley Additive exPlanations (SHAP) framework of top 14 final features for the prediction of MAKE. Each dot denotes a SHAP value for a feature in a particular individual. The dot color represents if the feature is present or absent (categorical data) or high vs. low (continuous data), whereas blue denotes absent/low and red denotes present/high. The X-axis represents the scale of SHAP values. A positive SHAP value for a particular feature indicates the feature increases the predicted risk of the outcome, while a negative value indicates the feature reduces the predicted risk of the outcome. The Y-axis includes features ordered from top to bottom by their impact on the model prediction based on mean absolute SHAP values. EXP =exposure; Non-EXP =non-exposure.