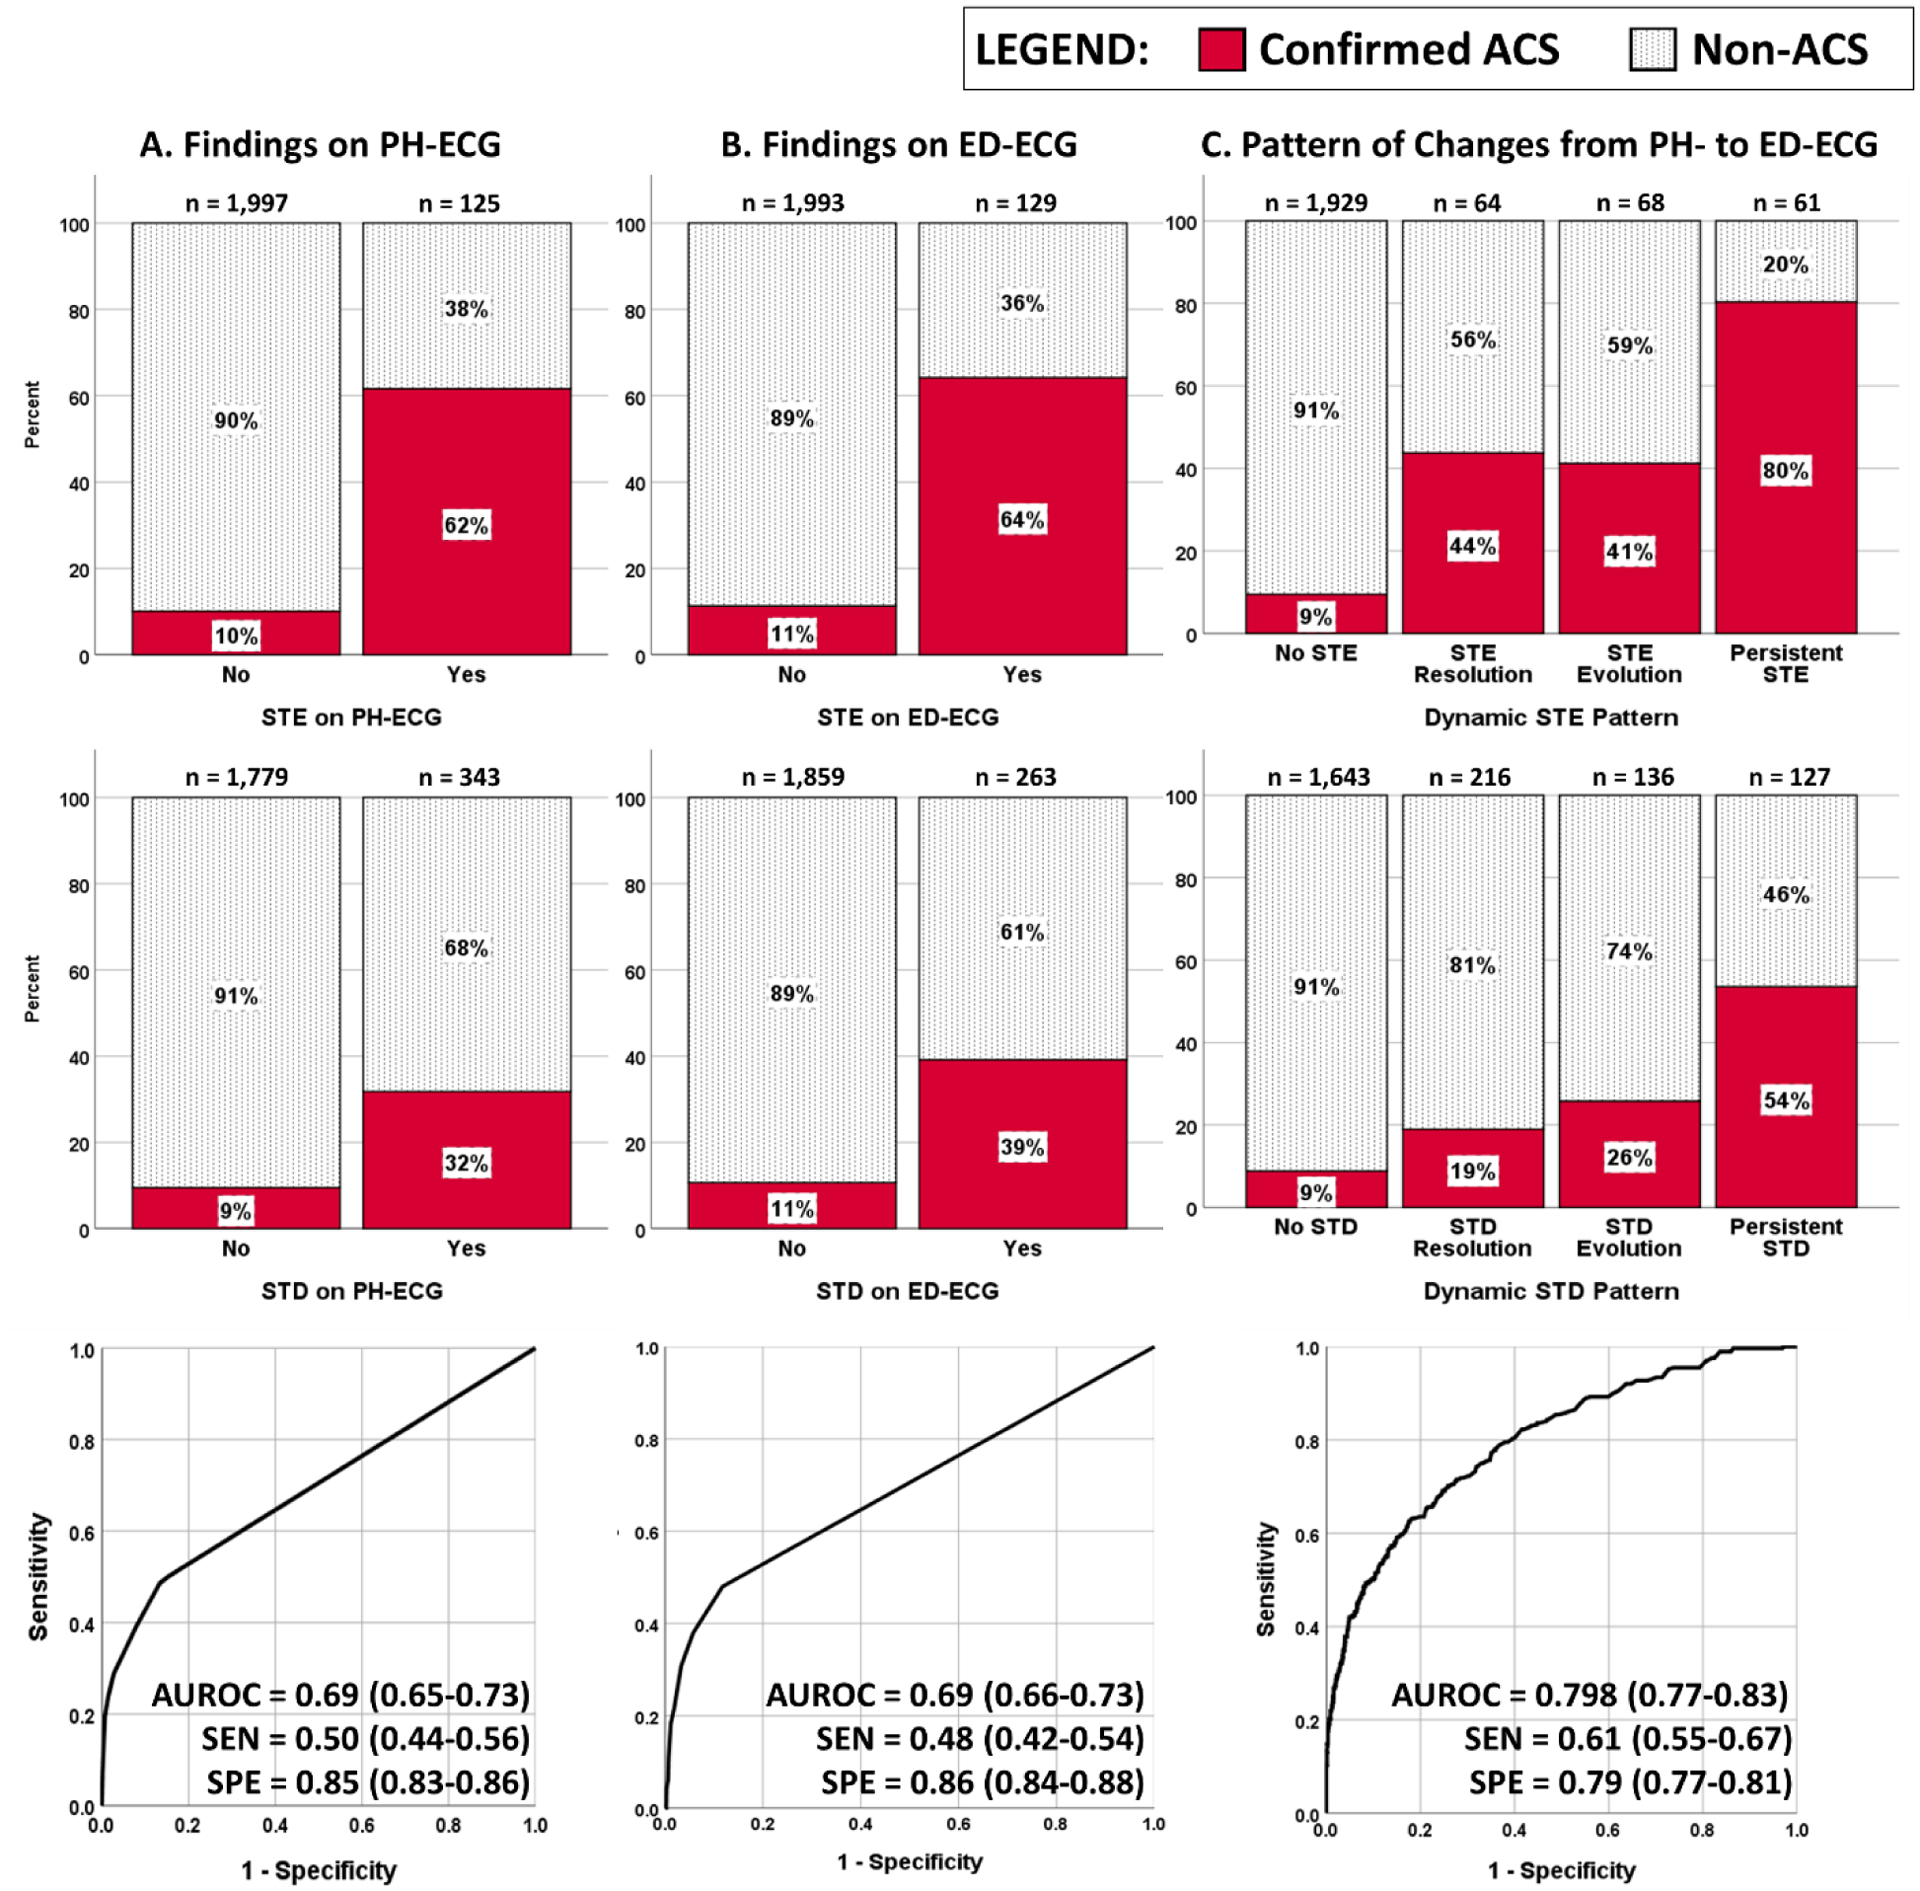
Figure 1: The relationship between ischemic ECG findings and acute coronary syndrome.

This figure shows how diagnostic ST changes correlated with acute coronary syndrome (ACS) on the prehospital (PH)-ECG (A), emergency department (ED)-ECG (B), and serial dynamic changes between both ECGs (C). ECG changes included diagnostic ST elevation or ST depression interpreted retrospectively by independent reviewers as per the 4th universal definition of MI guidelines.12 We excluded from this analysis patients with prehospital CATH laboratory activation for suspected STE-ACS identified in the field by paramedics. Area under ROC (AUROC) curves are based on a logistic regression classifier using the ST changes seen on each ECGs or their dynamic patterns. SEN: sensitivity, SPE: specificity. AUROC, SEN, and SPE are reported as value (95% CI).
