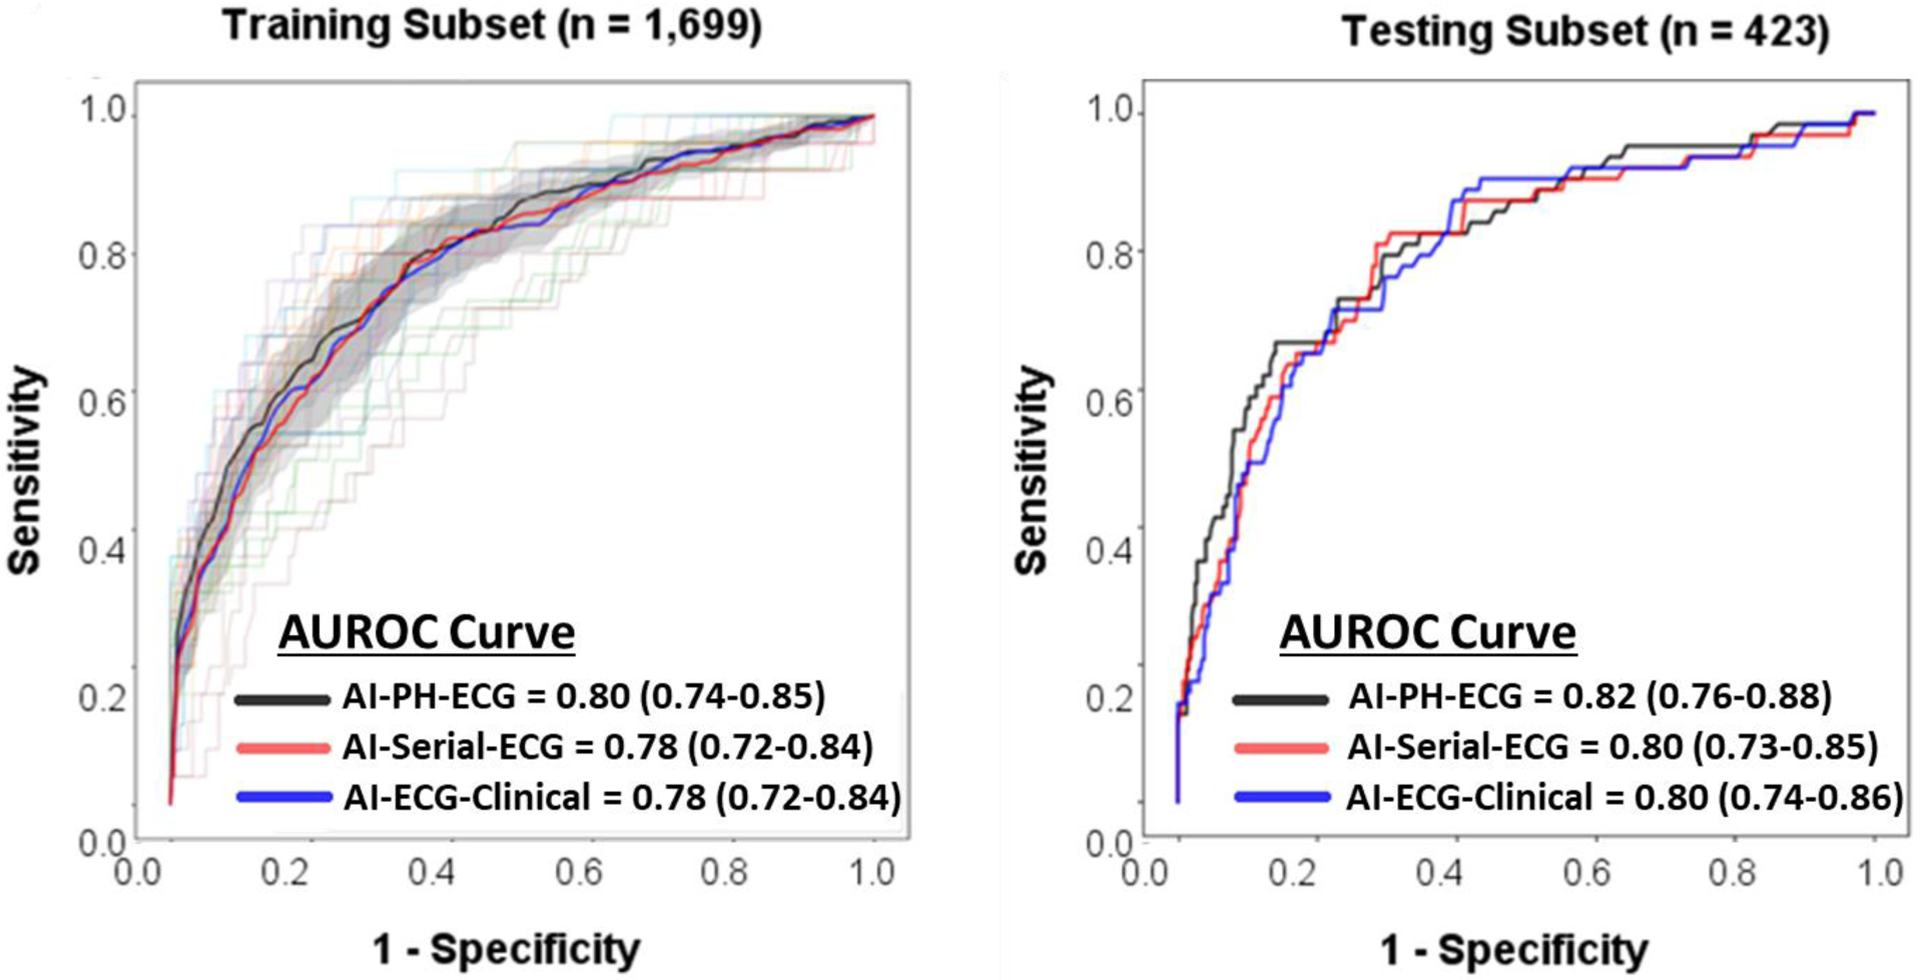
Figure 3: Classification performance of AI-augmented ECG analysis supplemented by serial ECG and clinical data.

This figure shows the baseline classification performance of random forest model using features from prehospital ECG (AI-PH-ECG), both prehospital and ED ECGs (AI-serial-ECG), and serial ECG plus clinical data typically available during triage (AI-ECG-Clinical) on both training subset (left) and testing subset (right). This figure demonstrates that AI augmented ECG analysis reaches its classification performance plateau with PH-ECG alone, with no additional gain in performance when adding serial ECG or any other clinical data elements. In the training set, the lighter lines correspond to the results obtained for the individual folds during the 10-fold cross-validation, whereas the thicker lines correspond to the mean results for each model. The shaded areas highlight the space englobing all curves within 2 standard error around the mean curves.
