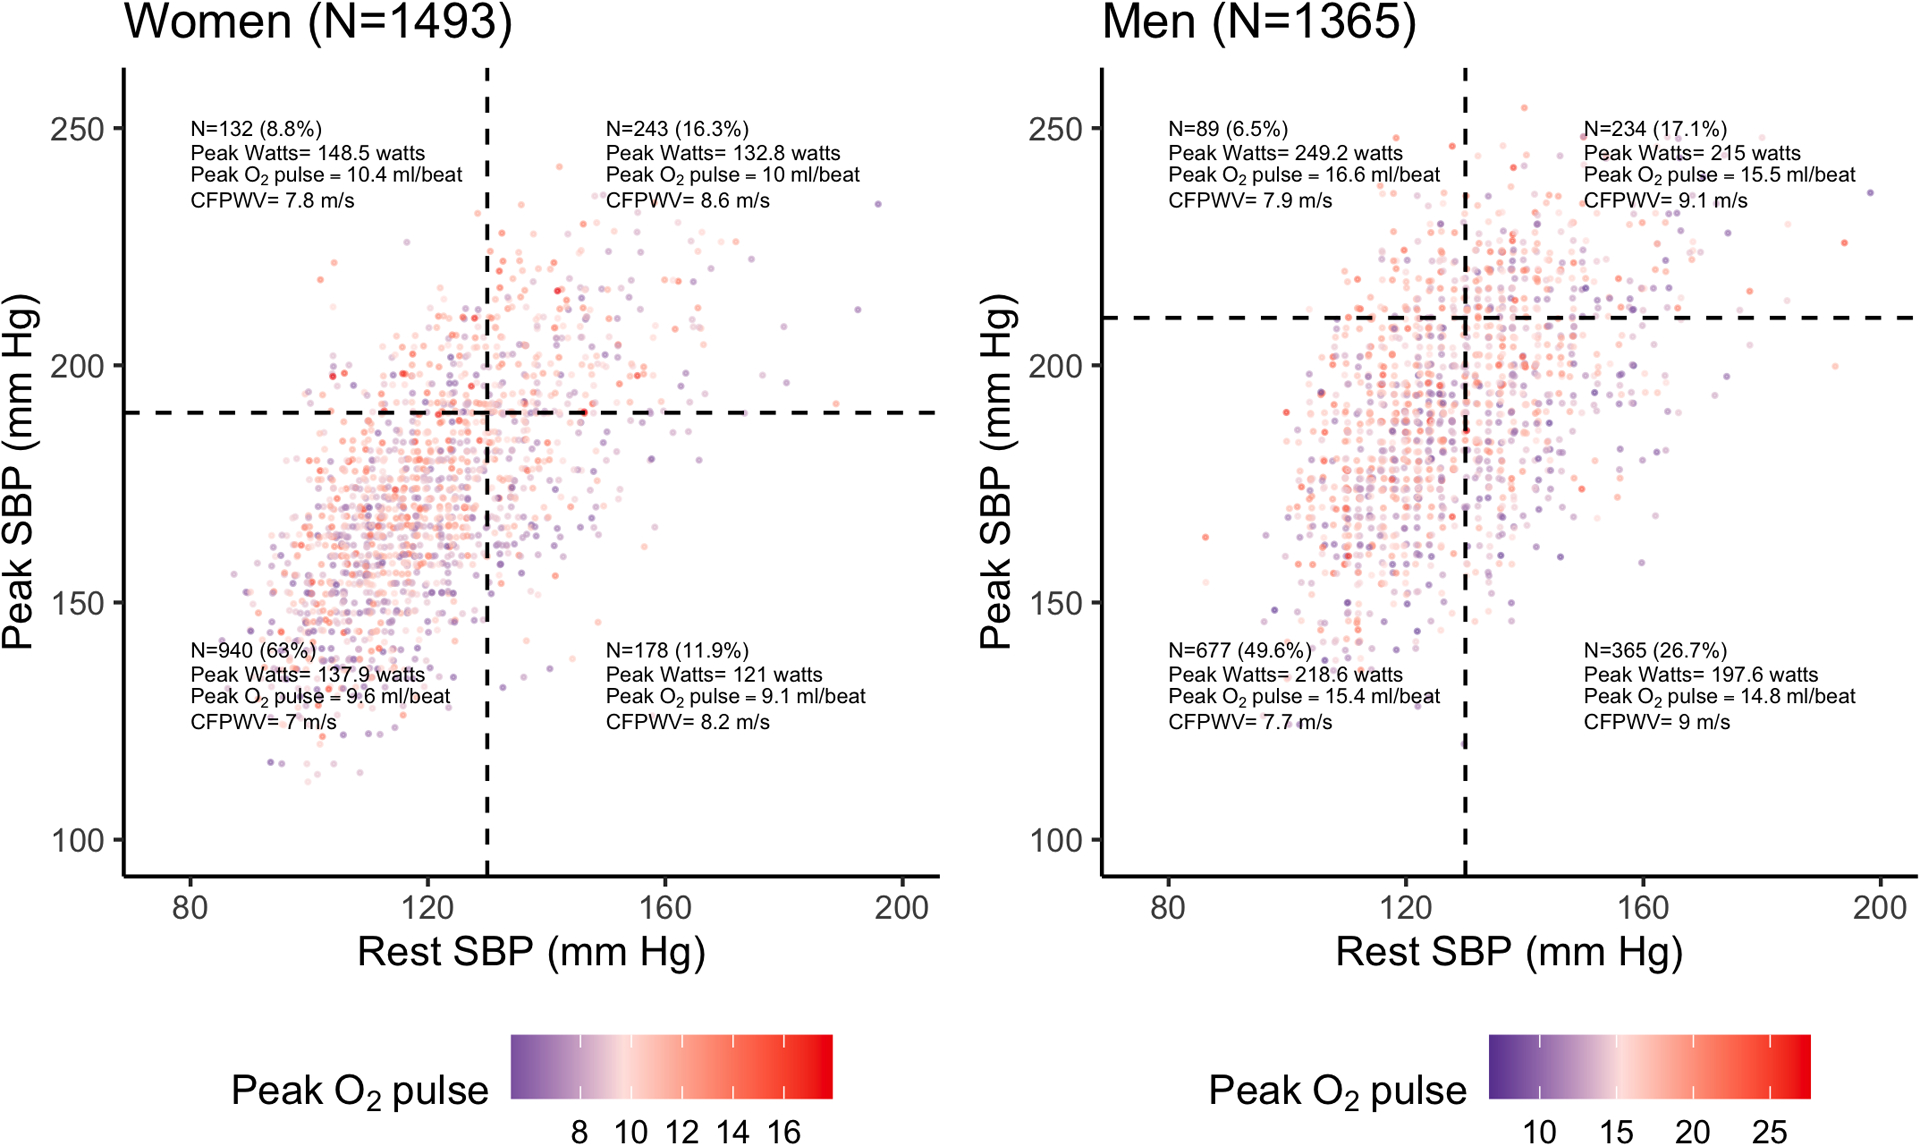
Figure 2. The distribution of peak systolic blood pressure across ranges of resting systolic blood pressure.

Rest and peak exercise systolic blood pressure (SBP) were plotted for each participant separately in men and women. Points are colorized by the peak O2 pulse achieved. Dotted lines were placed at 130 mm Hg to denote elevated rest SBP and 210 mm Hg for men and 190 mm Hg for women to denote elevated peak SBP. The N and mean workload (“peak watts”), peak O2 pulse, and carotid-femoral pulse wave velocity are displayed for each quadrant.
