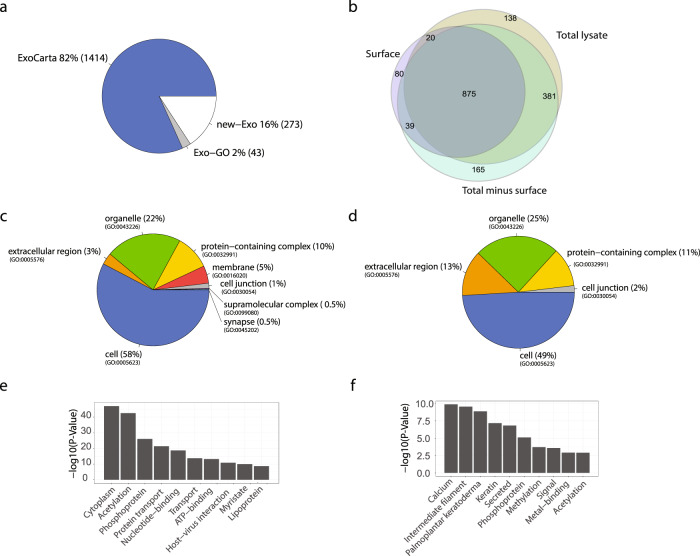
Fig. 3. Global proteomic analysis and GO annotation of SF-sEVs proteins.
a Proteins identified by MS analysis of SF-sEVs and PC3 sEVs were compared against the ExoCarta and GO databases. b Venn diagram representation of the proteins identified in the three SF-sEVs fractions. c Pie chart representation of Gene Ontology Cellular Component categories (GO-CC) for proteins enriched in total minus surface. d GO-CC categories for proteins enriched in surface fractions. e Top ten terms obtained by functional annotation analysis in DAVID for proteins enriched in total minus surface fractions. f Top ten terms identified in DAVID for proteins enriched in surface fractions. Only proteins identified in at least two samples were included in the analysis.

