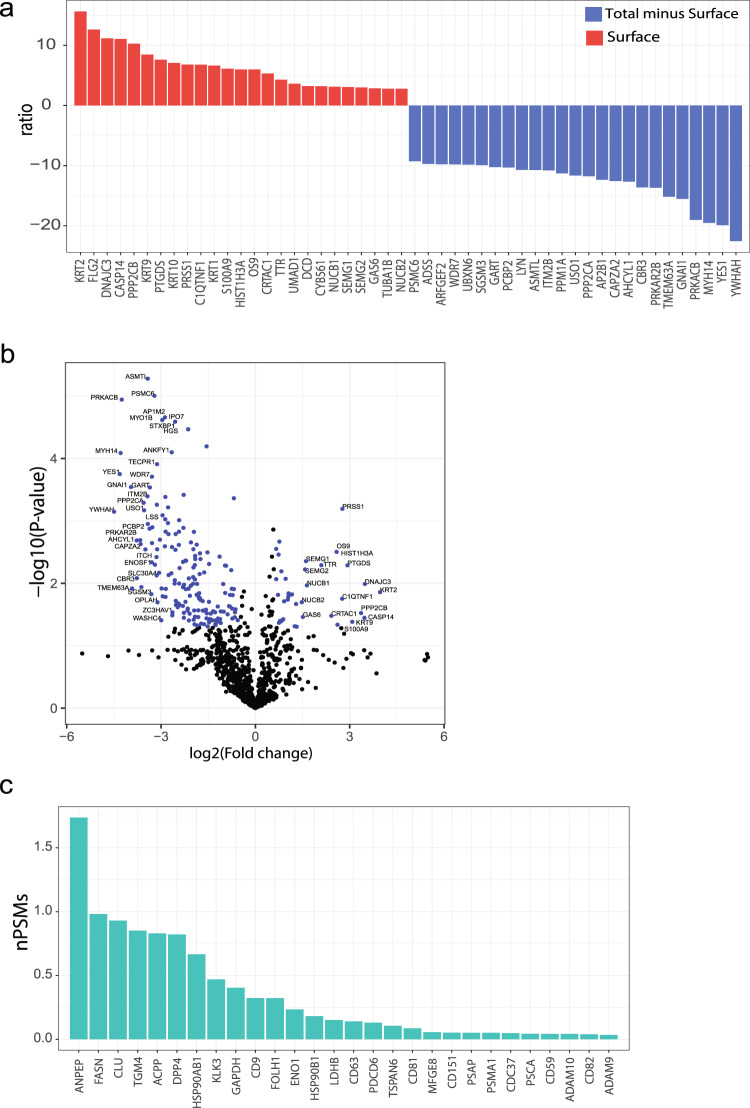
Fig. 4. Surface proteins expression in SF-EVs.
a Proteins identified in the surface and in total minus surface fractions were compared by fold change and t-test statistical analysis. a The bar plot represents the ratio of the 25 most enriched proteins in surface and in total minus surface fractions. b The volcano plot represents fold changes and P-value for proteins identified at least in two samples. c Abundance in normalized peptide spectrum matches (nPSMs) of known sEV markers in the surface fraction of SF-sEVs.

