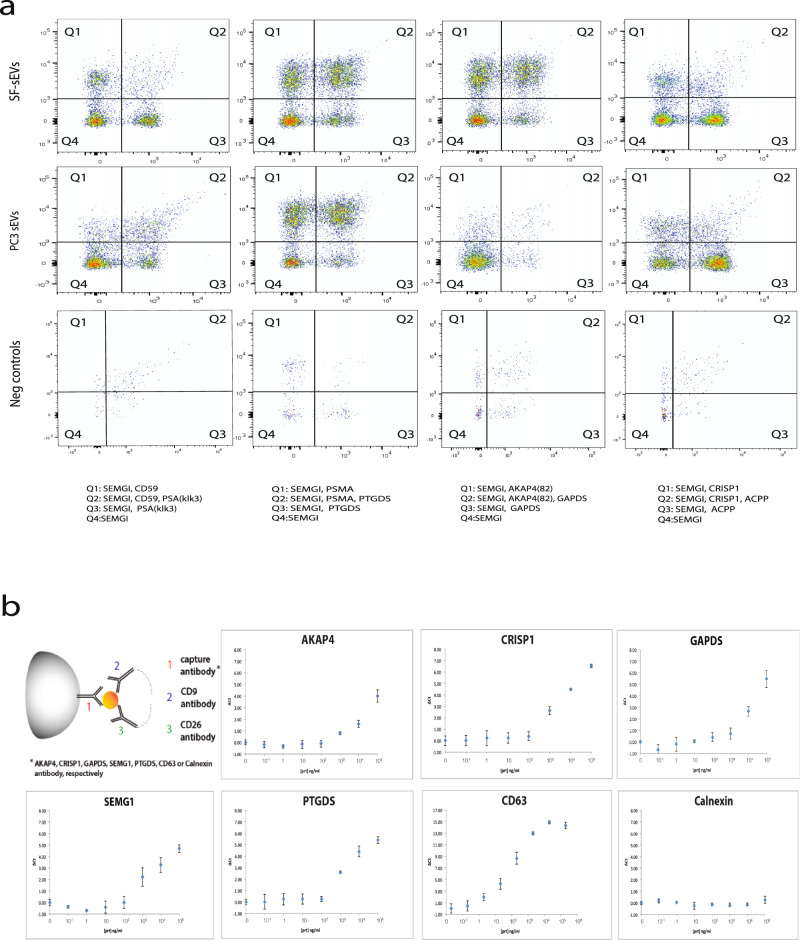
Fig. 5. Validation of surface protein markers on SF-sEVs and PC3 sEVs by Exo-PLA and SP-PLA.
a Combination of different markers on the surface of sEVs detected by Exo-PLA. Gating of positive signals in flow cytometry and different populations are displayed. b SF-sEVs were captured by beads coated with antibodies for specific targets identified by HRMS analyses (CRISP1, AKAP4, GAPDS, SMG1, and PTGDS), indicated for each panel, and detected with PLA probes against CD9 and CD26 markers. The abundant marker CD68 was used as capture for positive control of assay performances, the ER marker calnexin was used as negative control capture antibody. The x-axes display the concentration of samples in ng of total protein per ml. The y-axes display the differences between the threshold cycle for the real-time PCR readout of SP-PLA reactions for the samples and the threshold cycle of the negative control (assay buffer without samples). The error bars are representing standard deviation (SD), each sample was run in triplicate.

