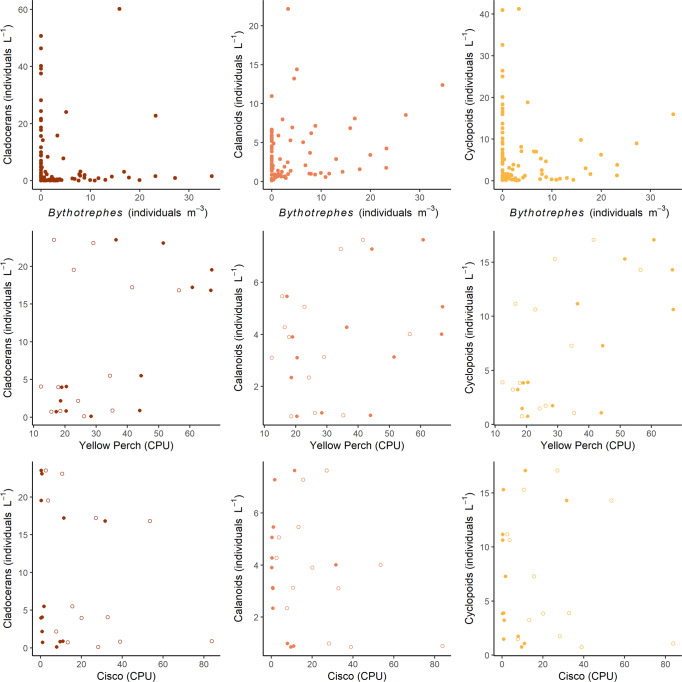
Fig. 5. Relationships (2006–2018) between abundances of native zooplankton groups (cladocerans, calanoids, and cyclopoids, individuals L–1) and predators of zooplankton (Bythotrephes, n = 87, individuals m–3; yellow perch and cisco, n = 13 observation for each fish-location combination, CPU, catch per unit effort).
Open symbols represent fish data from offshore gill nets, and closed symbols represent fish data from nearshore gill nets. The linear relationships between nearshore yellow perch and both cladocerans and cyclopoids were significant (p = 0.0053 and 0.0011, r = 0.722 and 0.799, respectively).

