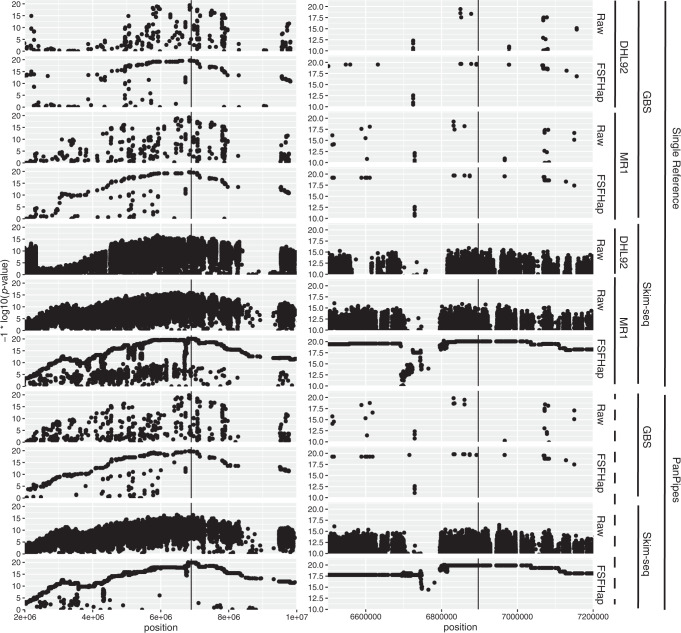
Fig. 4. Genetic resolution of the fom2 locus using assorted methods.
Both panels show association statistic for all variants across the fom2 interval (see “Methods”). The chemical and analytical genotyping factor combinations are indicated at the far right. Because PanPipes uses both references simultaneously, this factor is shown as a dotted line. “Raw” indicates initial set of filtered variants and FSFHap is the result of imputing the Raw variants. The left panel presents an expanded view of the interval, while the right shows the 700 kb bounding the previously fine-mapped NBS-LRR protein, shown as a vertical black bar in all plots. The combination skim-seq/SR-DHL92 could not be properly imputed and so only “Raw” is shown.

