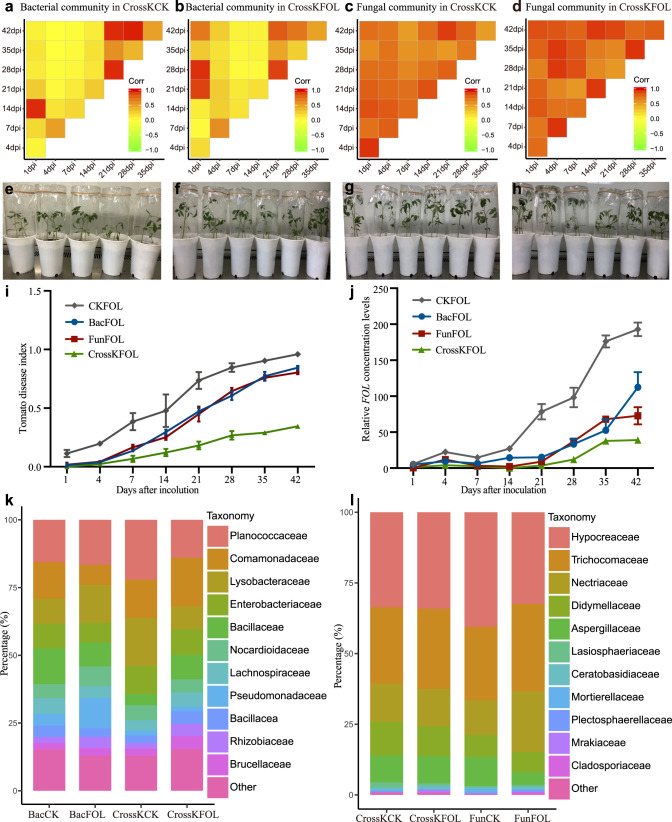
Fig. 4. Relative abundance dynamics of the constituents of different SynComs after inoculation of germ-free tomato seedlings, and FWD index under different treatments after 42 d of growth in a sterile growth chamber.
a–d The pairwise correlations between CrossKCK and CrossKFOL SynComs of bacterial or fungal communities at different time points as reflected by Pearson’s correlation coefficients. The yellow color indicates the value of Pearson’s correlation coefficients lower than 0.5, and the red color indicates the value of Pearson’s correlation coefficients greater than 0.5. e–h Representative images of germ-free tomato seedlings at 14 d inoculated only with FOL (e), FOL together with bacterial SynComs (f), FOL together with fungal SynComs (g), or FOL together with cross-kingdom (bacteria and fungi) SynComs (h). i FOL disease indexes of tomato inoculated with CKFOL, BacFOL SynComs, FunFOL SynComs, and CrossKFOL SynComs during 42 d of growth in a sterile growth chamber were compared (P < 0.05, Kruskal–Wallis test with Dunn’s post hoc test, n = 24 biologically independent plants). Each time point represents the mean FWD index ± s.e.m. (n = 24 biologically independent plants). j The FOL levels in the CKFOL, BacFOL SynComs, FunFOL SynComs, and CrossKFOL SynComs were compared (P < 0.05, Kruskal–Wallis test with Dunn’s post hoc test, n = 3 biologically independent plants). Each vertical bar represents the s.e.m from three biologically replicates. k, l Relative abundance of dominant bacterial (k) and fungal taxa (l) in different SynComs groups at the family level. CKFOL, germ-free tomato plants inoculated with FOL; BacFOL, germ-free tomato plants inoculated with Bac SynComs and FOL; FunFOL, germ-free tomato plants inoculated with Fun SynComs and FOL; CrossKCK, germ-free tomato plants inoculated with cross-kingdom SynComs without FOL; CrossKFOL, germ-free tomato plants inoculated with cross-kingdom SynComs and FOL.

