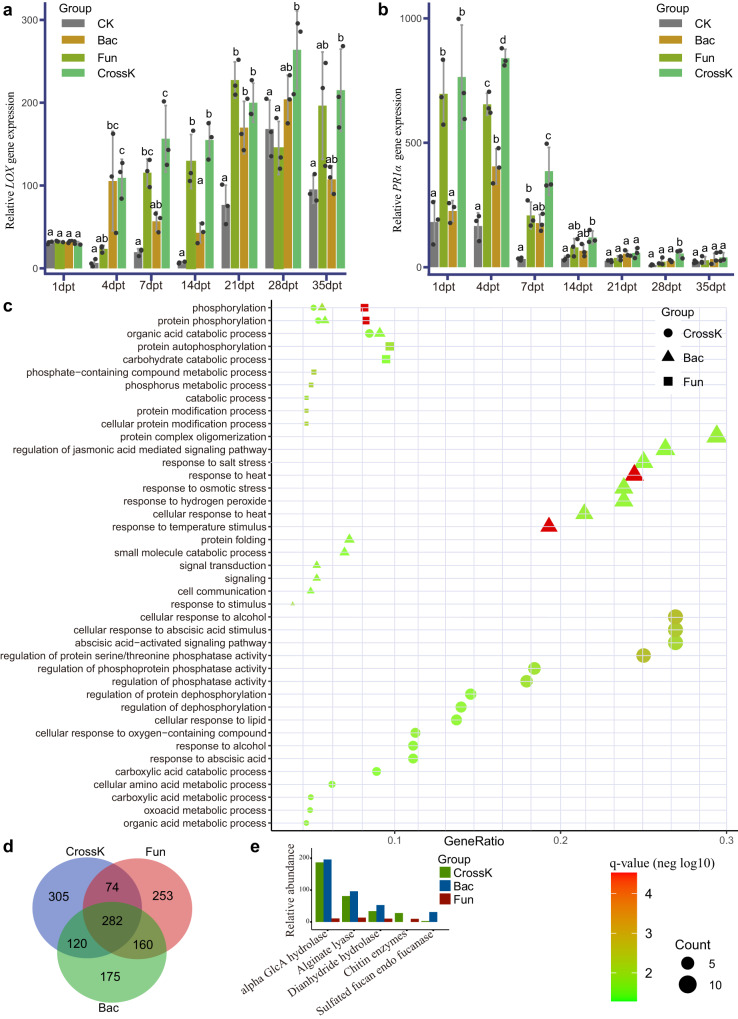
Fig. 6. Relative abundance of plant transcripts and expression of biomarker genes in different SynComs groups based on real-time reverse-transcription-quantitative polymerase chain reaction (RT-qPCR), transcriptome sequencing, and metagenomic sequencing.
a, b Expression of genes for salicylic acid (SA)-responsive LOX defensin (a) and jasmonic acid (JA) pathogenesis-related protein 1 acidic (PR1α) (b), determined using RT-qPCR, in different SynComs groups at the specified time points. The statistical significance was calculated based on two-way ANOVA and Tukey HSD (P < 0.05) and the statistical test used was two-sided. Values are means of three independent replicates with standard error (SE). The expression of each gene was normalized to that of the β-actin reference gene (n = 3 biologically independent plants). c Comparison of tomato plant GO term enrichment in plants inoculated with cross-kingdom, bacterial, and fungal SynComs (Benjamini–Hochberg adjusted two-way ANOVA P value <0.05). The q value means FDR-adjusted P values and the size of “Count” indicates the number of significantly enriched genes contained in the corresponding pathways; the larger the point the greater the number of significantly enriched genes. d Venn diagram of significantly differentially expressed genes (compared with CK group, FDR < 0.05) in tomato plants inoculated with cross-kingdom, bacterial, and fungal SynComs. e Bar plot of relative abundance of biomarkers of resistance pathway genes in cross-kingdom, bacterial, and fungal SynComs. Bac, germ-free tomato plants inoculated with bacterial SynComs; Fun, germ-free tomato plants inoculated with fungal SynComs; CrossK, germ-free tomato plants inoculated with cross-kingdom SynComs.

