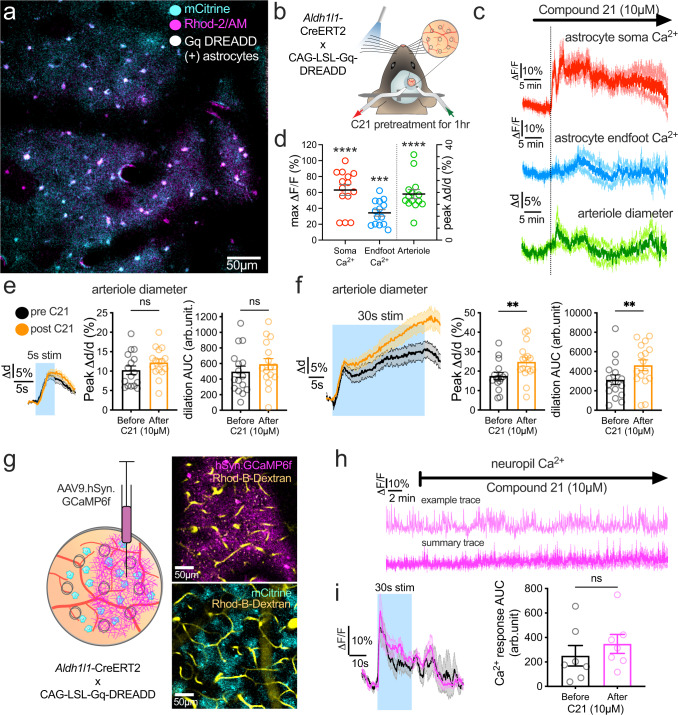
Fig. 4. Chemogenetic stimulation of astrocytes enhances the late phase of sustain functional hyperemia.
a Representative 2-photon image in barrel cortex (one from seven animals) of a Aldh1l1-Cre x CAG-LSL-Gq-DREADD mouse. Astrocytes are loaded with Rhod-2/AM (magenta, median filtered) and express Gq-DREADD-mCitrine (cyan, median filtered). b Cartoon of awake mouse sensory stimulation experiment in the presence of C21 delivered via a perforated window. c Average traces of astrocyte soma and endfoot Ca2+ and penetrating arteriole (PA) diameter in response to the local superfusion of the DREADD agonist C21 into the perforated window (n = 7 mice). d Summary data of peak responses to C21 application. All comparisons were Paired t tests (two-sided). Astrocyte soma Ca2+: n = 14 astrocyte somata and endfeet (average of 38 cells), and n = 14 PA. All data are from 7 mice. e Left: Average arteriole diameter traces in pre-drug control (black) and in the presence of C21 (orange), in response to 5 s whisker stimulation (n = 16 PA from 6 mice). Right: summary data showing peak dilation and Area Under the Curve (AUC) for 5 s in control and C21. Peak dilation and AUC of dilation: Paired t test (two-sided). N = 16 PA, 6 mice. f Same as e but for 30 s whisker stimulation. g Left: Cartoon showing the site of AAV9.hSyn.GCaMP6f injection 4 weeks prior to acute cranial window experiment. Top Right: Representative image from experiments in 5 mice of neuronal AAV9.hSyn.GCaMP6f expression (magenta) and Rhodamine-B-Dextran (yellow, median filtered image) labeled vasculature in the lateral side of the window imaged at 920 nm. Bottom Right: image of astrocytic mCitrine expression (cyan) in the medial side of the window imaged at 980 nm. h Time series measurements of neuronal Ca2+ in response to the local superfusion of the DREADD agonist C21 into the perforated window. Upper trace shows a representative region of interest (ROI). Lower trace shows averaged data, n = 5 ROI from 5 mice. i Average neuronal Ca2+ traces in pre-drug control (black) and in the presence of C21 (magenta), in response to 30 s whisker stimulation. n = 7 perivascular ROI from 5 mice. Right: summary data showing AUC for 30 s stimulation before and after C21. Paired t test (two-sided). All average trace and summary dot plot data show mean ± SEM. For further statistical details see Supplementary Table 4. Source data are provided as a Source Data file.

