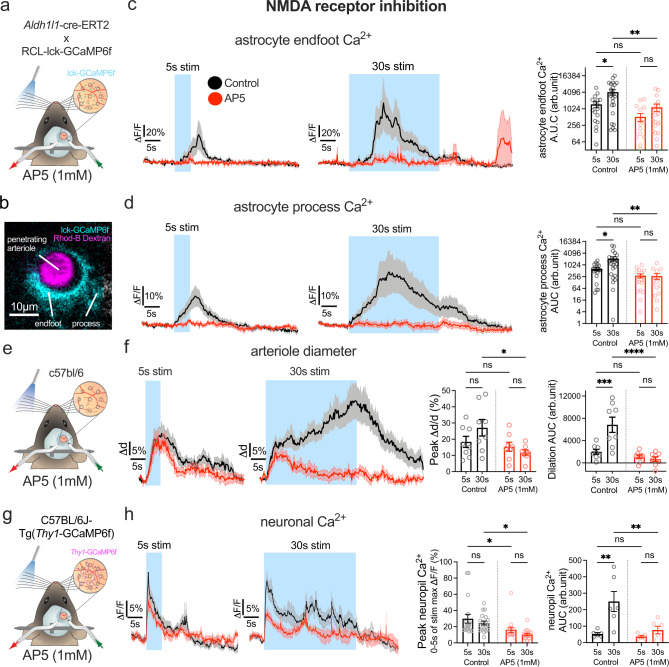
Fig. 5. NMDA receptor inhibition abolishes astrocyte activation and reduces the late component of sustained functional hyperemia.
a Cartoon of awake mouse 2-photon imaging experiment with sensory stimulation and perforated window for AP5 superfusion in Aldh1l1-CreERT2 × R26-lck-GCaMP6f mice. b 2-photon image of a penetrating arteriole (PA) (magenta, median filtered image) and surrounding astrocyte expressing membrane targeted lck-GCaMP6f (cyan). One example from 8 experiments from 8 mice. c Left: Average time series trace data of astrocyte endfoot Ca2+ in pre-drug control (black) and in the presence of AP5 (red) surrounding a PA in response to 5 s (n = 18 trials at 7 PA from 7 mice) and 30 s (n = 25 trials at 8 PA from 8 mice) whisker stimulation. Right: summary data of Area Under the Curve (AUC). d Same as for c but for astrocyte arbor Ca2+. 5 s stimulation: n = 18 trials at 7 PA from 7 mice 30 s stimulation: n = 24 trials at 8 PA from 8 mice. e Cartoon of a C57Bl/6 mouse with whisker puffer and perforated cranial window for superfusion of AP5. f Left: Average traces of penetrating arteriole diameter in pre drug control (black) or in the presence of AP5 (red), in response to 5 s or 30 s (n = 8 PA from 7 mice) whisker stimulation. Right: summary data of dilation peak and AUC (average of 3–4 trials per vessel). Peak dilation and AUC. g Cartoon of a Thy1-GCaMP6f mouse with whisker air puffer and perforated cranial window for superfusion of AP5. h Left: Average traces of neuronal Ca2+ in pre drug control (black) or in the presence of AP5 (red), in response to 5 s (control n = 18 trials, AP5 n = 15 trials) or 30 s whisker stimulation (control n = 19 trials, AP5 n = 18 trials) recorded from 6 perivascular ROIs from 6 mice. Right: summary data of maximum neuronal Ca2+ signal in the first 5 s of stimulation and neuropil Ca2+ signal AUC of stimulation period. Max ΔF/F and AUC. Control 5 s and 30 s: n = 6 ROIs, AP5 5 s: n = 5 ROIs; 30 s: n = 6 ROIs. All average trace and summary dot plot data show mean ± SEM. All statistical tests were Two-way ANOVA with Tukey’s multiple comparisons (two-sided). For further statistical details see Supplementary Table 5. Source data are provided as a Source Data file.

