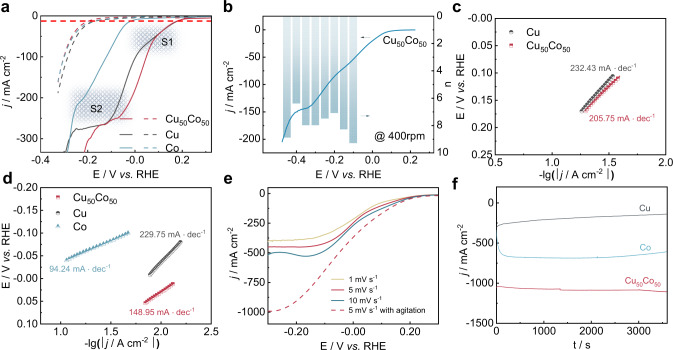
Fig. 2. Electrochemical responses of Cu50Co50, pure Cu, and pure Co catalysts.
a j-E curve (80% iR corrected) over Cu50Co50, pure Cu, and pure Co modified Ni foams (catalysts loading was 5 mg cm−2) in 1 M KOH solution containing 100 mM KNO3 (solid lines) or in the absence of KNO3 (dotted line) at a scan rate of 1 mV s−1 (the red dash line presenting the j of 10 mA cm−2, the shading S1 and S2 presenting the peak around 0.2 to 0.05 V and 0.05 to −0.15 V, respectively). b j-E curve (80% iR corrected) at 400 rpm and electron transfer numbers at different potentials calculated by the K–L equation for Cu50Co50 on RDE in 100 mM KNO3 + 1 M KOH electrolyte at a scan rate of 10 mV s−1 (catalysts loading was 0.25 mg cm−2). Tafel slopes in the potential range of peak S1 (c) S2 (d). e j-E curves over Cu50Co50 modified Ni foam in 1 M KOH solution containing 100 mM KNO3 at different scan rates without agitation (solid line) and at a scan rate of 5 mV s−1 with agitation (catalysts loading was 5 mg cm−2). f Time-dependent current density curves over Cu50Co50, Cu, Co modified Ni foam at −0.2 V with a magnetic stirring speed of 1000 rpm (catalysts loading was 5 mg cm−2).

