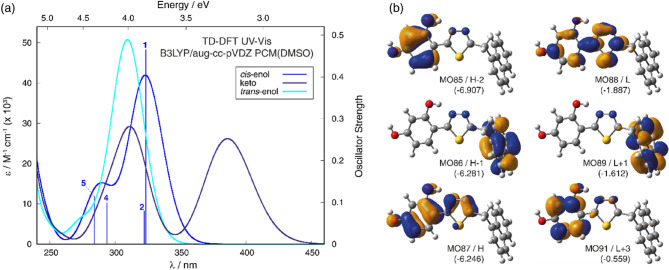
Figure 5.
Panel (a): TD-DFT-simulated (B3LYP/aug-cc-pVDZ/PCM(DMSO) at B3LYP + D3/6–311 + + G(d,p)/PCM(DMSO)-optimized structures) UV–Vis spectra for NTBD in its enolic (cis and trans) and keto forms with selected excitation energies and oscillator strengths calculated for cis-enol indicated as ‘stick’ spectra. Panel (b): Isosurfaces (± 0.04 au) of MOs involved in selected electronic transitions of NTBD cis-enol. H / L stands for HOMO/LUMO. Values listed in parentheses are corresponding orbital energies, in eV. For a full set of computed data, see Supplementary Materials.

