Figure 8.
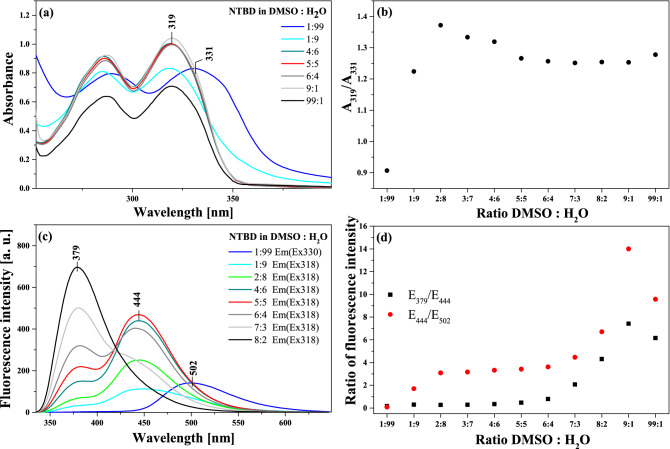
Panel (a): Absorption spectra of NTBD in DMSO: H2O solutions with various – 1:99, 1:9, 4:6, 5:5, 6:4, 9:1 and 99:1 – volume ratio. Panel (b): Correlation between the ratio of absorbance at the wavelength of 319 nm to the one at 331 nm and the ratio of DMSO to H2O in mixed solution. Panel (c): Fluorescence emission spectra of NTBD in DMSO: H2O solutions with various – 1:99, 1:9, 2:8, 4:6, 5:5, 6:4, 7:3 and 8:2 – volume ratio. The excitation was set at the absorbance maximum of each sample, respectively as pointed in the figure. Panel (d): Correlation between the ratio of fluorescence emission at the wavelength of 379 nm to the one at 444 nm along with the ones at 444 nm to 502 nm and the ratio of DMSO to H2O in mixed solution. The experiments were conducted at room temperature.

