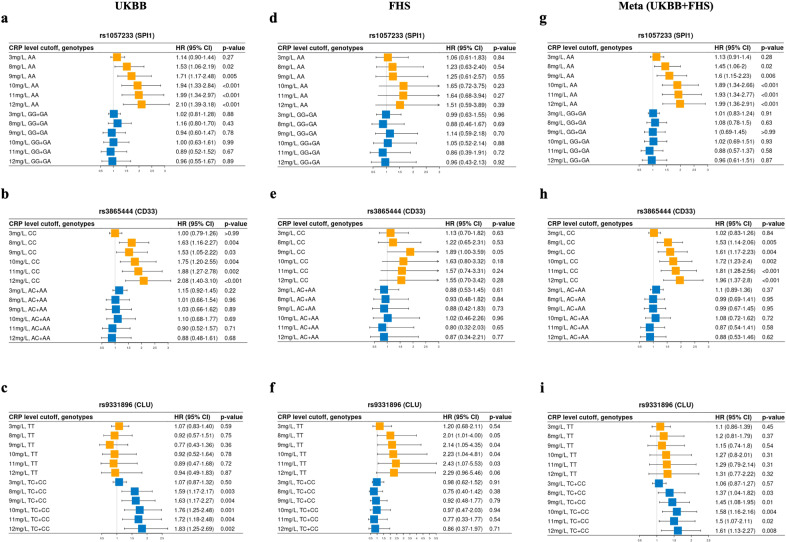
Fig. 3. Forest plots of the results from UKBB, FHS and meta-analysis for the stratified genotype analysis of 3 SNPs for the effect of CRP levels on AD incidence.
The Cox proportional hazard regression models were applied to estimate the effect of different levels of serum CRP on the incidence of AD among different genotypes of SPI1, CD33, and CLU after adjusting for age, sex, years of education, APOE ε4 and PCs. The results from UKBB are shown (a–c), and those from FHS are shown (d–f). The results from the meta-analyses of UKBB and FHS are shown (g–i). Raw P values are presented. For all CRP cutoffs from 3–12 mg/L, refer to Fig. S2.

