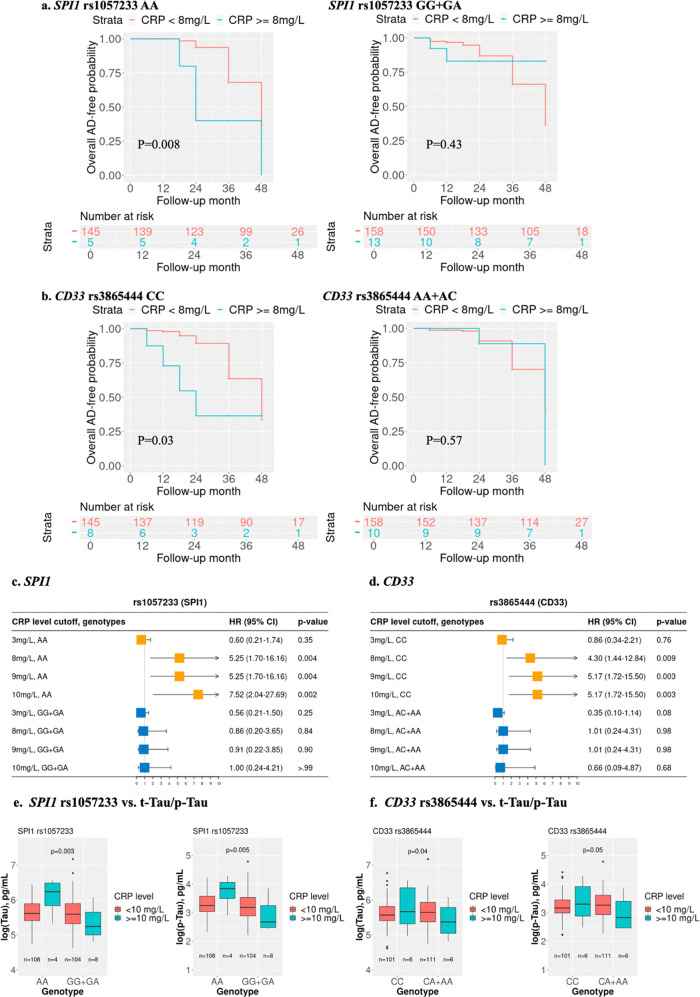
Fig. 4. Kaplan‒Meier survival plots and forest plots using the ADNI cohort for the stratified genotype analysis for the effect of CRP levels on MCI-AD conversion in the Cox proportional hazard regression models and boxplots for CRP-SNP interaction effects on CSF biomarkers (t-Tau and p-Tau): SPI1 rs1057233 and CD33 rs3865444.
ADNI MCI participants were stratified by genotypes. Kaplan‒Meier survival plots were generated for AD free time for SPI1 rs1057233 and CD33 rs3865444 genotypes; Red: CRP < 8 mg/L, Green: CRP ≥ 8 mg/L (a, b). Forest plots with the estimated effect of different levels of serum CRP on the MCI-to-AD conversion among different genotypes after adjusting for age, sex, education and APOE ε4 (c, d). ADNI participants with measured CSF AD biomarkers were stratified by genotype. t-Tau and p-Tau measured at the last exam were log transformed and are shown in boxplots. p values of the interaction between CRP and SPI1 rs1057233/CD33 rs3865444 genotypes were calculated using linear regression analysis after adjusting for age, sex, education and APOE ε4. Red: CRP < 10 mg/L, Green: CRP ≥ 10 mg/L (e, f). Raw P values are presented.

