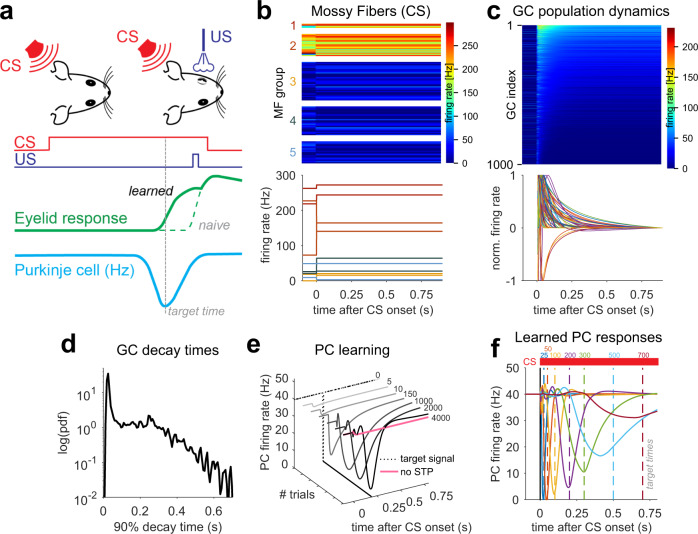
Fig. 2. Simulating Purkinje cell pauses during eyelid conditioning.
a Scheme of eyelid conditioning. CS: conditioned stimulus (red). US: unconditioned stimulus (violet). After experiencing CS and US pairings at a fixed temporal interval over many trials, the animal learns to close its eyelid just before the US is delivered (green). A pause in PC activity (blue) precedes the eyelid closure (target time, gray dashed line). b The CS is modeled as an instantaneous change in MF firing rate. Top: plot of firing rates of 100 MFs, sorted according to synaptic types (MF groups). MF firing rates are color-coded and drawn according to the distributions shown in Fig. 1b. Bottom: two sample MF rates per synaptic group. Colors as in Fig.1. c Model GC responses to the CS. Top: 1000 GCs sorted according to average firing rate after CS onset. Firing rates are color-coded. Bottom: steady-state subtracted and individually normalized GC transient responses. d Pdf of the distribution of GC activity decay times to 10% of the transient peak. e Example of delay eyelid conditioning over the course of 4000 learning steps for a 200 ms delay. Dashed line represents the target time used in the supervised learning procedure. Without STP-induced GC transients, no PC pause could be learned (pink line). f Simulated PC responses after 4000 learning trials for each target time (colored dashed lines).

