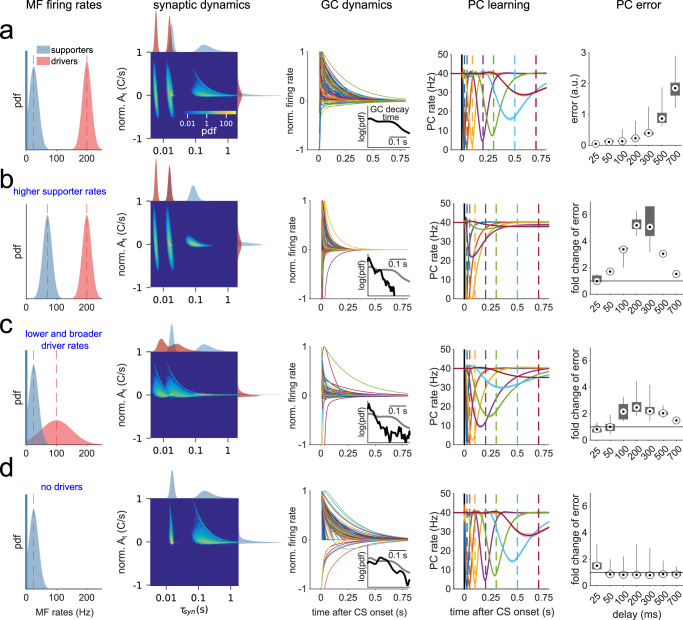
Fig. 4. Learning performance depends on MF firing rate distributions.
a First panel: Driver and supporter MF firing rate pdfs (μD = 200 Hz, μS = 25 Hz, σD = σS = 15 Hz). Second panel: Resulting joint At and τsyn distribution, featuring four partially overlapping clusters, corresponding to the slow and fast pools for driver and supporter synapses, and marginal distributions. The color code of the joint distribution scales logarithmically. Colors of marginal distributions indicate driver (red) and supporter (blue) components. Third panel: Normalized GC transient responses to CS. Inset: pdf of the distribution of decay times to 10% of the transient peak. Fourth panel: learned PC pauses, averaged over n = 20 simulations with different realizations of MF patterns and MF-GC connectivity. Dashed lines mark CS-US intervals (color code is the same as in Fig. 2e). Fifth panel: Error for each CS-US interval is calculated based on PC response amplitude, full-width at half-maximum and temporal deviation (Fig. S2a) and averaged over n = 20 realizations of MF patterns and MF-GC connectivity. Black lines indicate the distribution ranges; gray boxes indicate the 25th to 75th percentile range and black-white circles the medians. b Same as a, but with μS = 70 Hz. Inset: black line is the pdf for simulation with μS = 70 Hz and gray line is the pdf from (a) for comparison. Fifth panel: change in error relative to the average error in (a). c Same as (a), but with μD = 100 Hz and σD = 50 Hz. d Same as (a), but without driver inputs.

