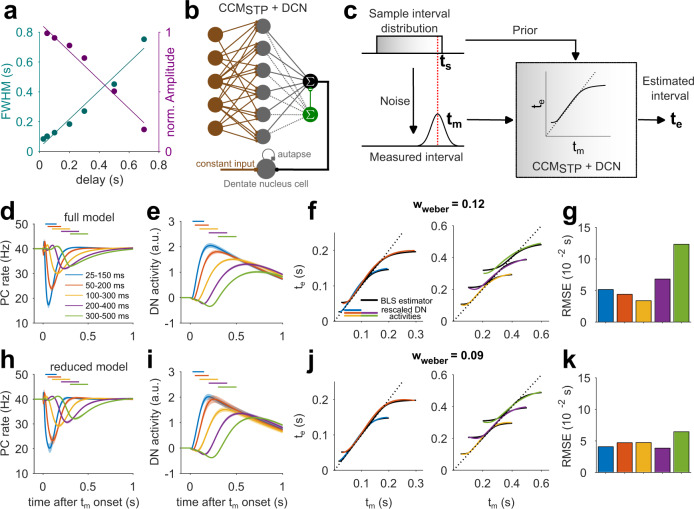
Fig. 6. STP-generated temporal basis enables the computation of Bayesian time-interval estimates.
a Full width at half maximum (cyan) and normalized amplitudes (magenta) of learned PC pauses versus delay interval from the experimentally constrained CCMSTP (see Fig. 2). Solid lines are linear fits. b Scheme of CCMSTP with added dentate nucleus cell. c Scheme of Bayesian integration. The sample interval ts (red dashed line, here drawn from a uniform distribution, upper left) is subject to a noisy measurement yielding a measured interval tm (lower left). CCMSTP implements Bayesian integration yielding an estimated interval te (right). d PC responses after 12,000 learning trials, averaged over n = 20 simulations with different realizations of MF patterns and MF-GC connectivity. Shaded area indicates standard deviation. Different colors represent learning of different uniform sample interval distributions. e Same as (d), but for DN cell activity. f Rescaled DN cell activity for different learned interval distributions (colored) and fitted theoretical Bayesian least squares (BLS) estimator (solid black line), with wweber = 0.12 resulting from fit. g Squared deviation of rescaled DN activity from the BLS estimator for all tested intervals. h–k Same as (d–g), but for the reduced model. The reduced model firing rate parameters were μD = 200 Hz, μS = 20 Hz, σD=10Hz and σS = 15 Hz and resulted in DN activity consistent with a Bayesian least squares model with wweber = 0.09.

