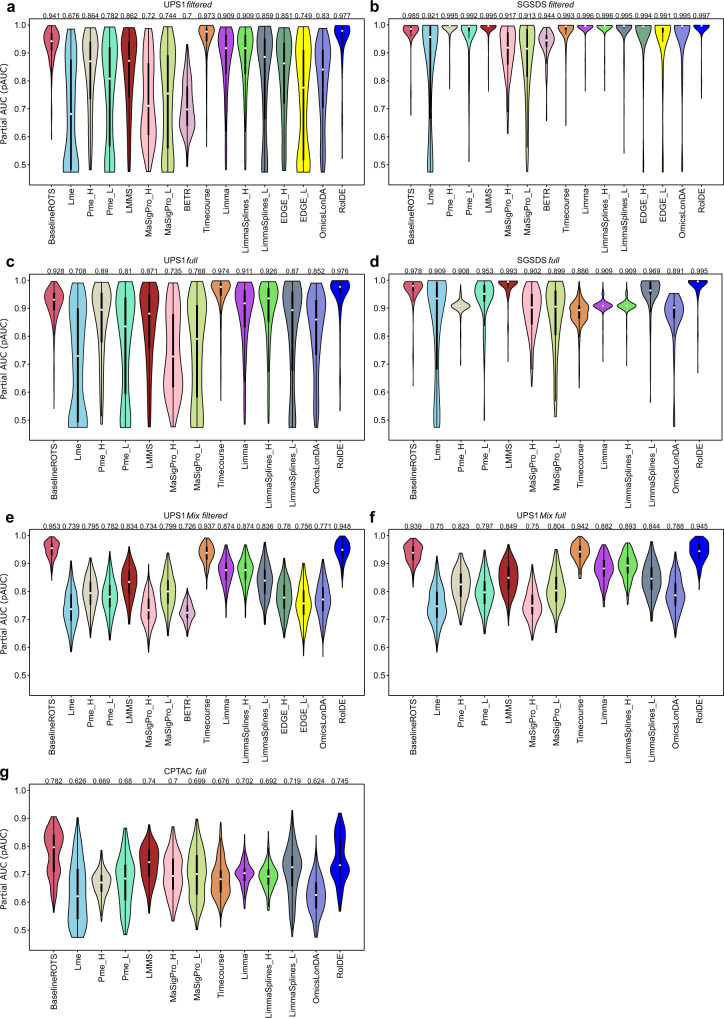
Fig. 2. The performance of the examined methods in the semi-simulated spike-in datasets.
a UPS1 filtered (n = 300 datasets), b SGSDS filtered (n = 210 datasets), c UPS1 full (n = 300 datasets), d SGSDS full (n = 210 datasets), e UPS1 Mix filtered (n = 300 datasets), f UPS1 Mix full (n = 300 datasets), g CPTAC full (n = 300 datasets). The methods were examined in their ability to detect true (known) longitudinal differential expression using receiver operating characteristic (ROC) analysis across datasets with varying longitudinal trend differences in the spike-in proteins (3 replicate samples per condition). The partial areas under the ROC curves (pAUC) between the specificity of 1 and 0.9 were used to measure the performance of the methods. The violin plots display the distribution of pAUCs for each method, including median (white circle), interquartile range (IQR) from the first to third quartile (black box), and 1.5* IQR (whiskers). The IQR mean pAUC for each method is shown above the violin. Each method is shown with a unique color. Source data are provided as a Source Data file.

