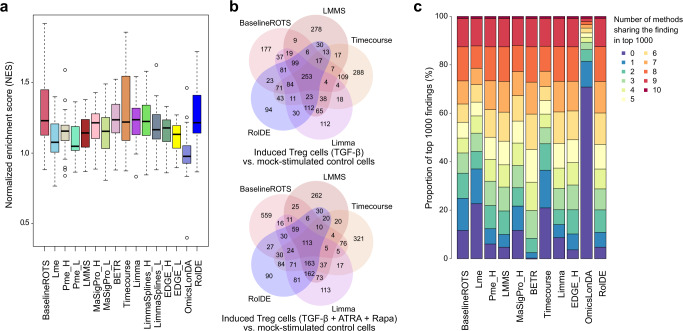
Fig. 4. Biological relevance and shared findings between the methods in the experimental human-induced T regulatory (iTreg) cell data.
a The normalized enrichment scores (NES) from the gene set enrichment analysis (GSEA) of 17 known Treg-related gene sets over comparisons of the two different induction protocols and the mock-stimulated control cells (n = 3 biologically independent samples in each comparison group, 34 NES values for each method). The boxplots display the NES scores for each method, including median (horizontal black line), interquartile range (IQR) from the first to third quartile (black box), and 1.5* IQR (whiskers). Each method is shown with a unique color. b Overlaps of the top 1000 findings with the five best performing methods in the two comparisons using the different induction protocols; with and without all-trans retinoic acid (ATRA) and rapamycin (Rapa). c Proportions of the top 1000 findings for each method detected also by different numbers (colors) of other methods in their top 1000 over the comparisons with both protocols. Source data are provided as a Source Data file.

