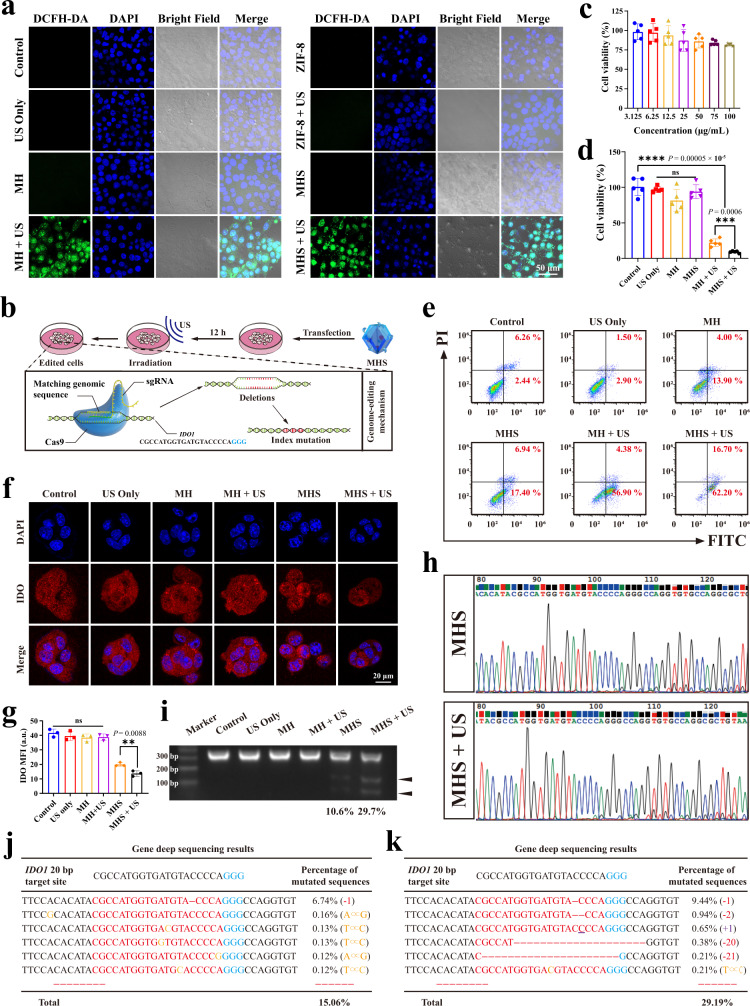
Fig. 3. Evaluation of US-associated IDO1 genome editing in vitro.
a Representative CLSM images of 4T1 cells with different treatments from three biologically independent samples. Concentration = 100 μg/mL. Incubation time = 12 h. b Illustration of transfection process of 4T1 cells by MHS upon US. c Toxicity evaluation in 4T1 after incubated with different concentrations of MHS and (d) Cell viability of 4T1 cells after various treatments for 24 h (n = 5 biologically independent samples). e Flow cytometry analysis of apoptosis of 4T1 cells with various treatments (n = 3 biologically independent samples). f Representative CLSM images and g corresponding mean fluorescence intensity of 4T1 cells treated with various treatments after IFNγ-stimulation, followed by staining with fluorescent anti-IDO antibody (red). DAPI was used to stain the nucleus of the cell (blue) (n = 3 biologically independent samples) h In vitro DNA sequencing of IDO1 in 4T1 cells after treatment with MHS and MHS + US. i Representative image of T7EI cleavage analysis after 4T1 cells with different treatments. j Deep sequencing analysis of gene editing in 4T1 cells in the presence of MHS and (k) MHS + US. The experiments for h, i, j, and k were repeated three times independently with similar results. Statistical differences for c, d, and g were calculated using two-tailed unpaired Student’s t-test for comparisons between two groups, ordinary one-way ANOVA for comparisons of more than two groups not containing Control, and Dunnett’s multiple comparisons post test for comparisons of more than two groups containing Control. Data were expressed as means ± SD. *P < 0.05, **P < 0.01, ***P < 0.001, ****P < 0.0001. Source data are provided as a Source Data file.

