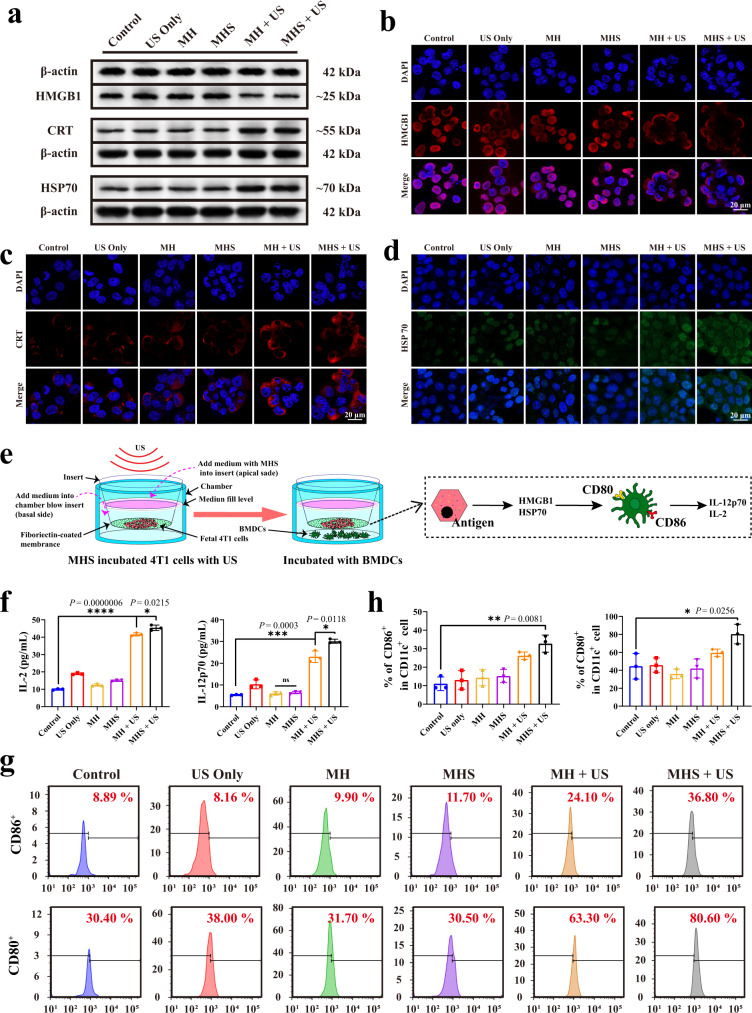
Fig. 4. ICD facilitates antitumor immunity against 4T1 cells in vitro.
a Western blot analysis of specific proteins expression after DAMPs (HMGB1, CRT and HSP70). 4T1 cells were left untreated, treated with US only, co-incubated with MH, MHS, MH + US and MHS + US. Concentration = 100 μg/mL. Incubation time = 12 h (Four times each experiment was repeated independently with similar results). b–d Immunofluorescence analysis of specific proteins expression after DAMPs, including HMGB1 (red), CRT (red) and HSP70 (green). 4T1 cells were left untreated, treated with US only, co-incubated with MH, MHS, MH + US and MHS + US. DAPI was used to stain the nucleus of the cell (blue). e Schematic diagram of the experiment to explore DC cells maturation in vitro. In the upper chamber, 4T1 cells were cultured without any treatment, treated with US only, co-incubated with MH, MH + US, MHS and MHS + US. And in the lower chamber, BMDCs were cultured. After co-cultured for 24 h, BMDCs are collected for analysis. f Secretion of IL-12p70 and IL-2 from the supernatant of BMDCs (n = 3 biologically independent samples). g Representative flow cytometry plots and h corresponding statistical data of matured BMDCs (CD80+CD86+CD11c+) after various treatments, including control, US only, MH, MH + US, MHS and MHS + US (n = 3 biologically independent samples). A representative image or plot of three biologically independent samples from each group is shown in b, c, d, and g. Statistical differences for f and h were calculated using two-tailed unpaired Student’s t-test, data were expressed as means ± SD. *P < 0.05, **P < 0.01, ***P < 0.001, ****P < 0.0001. Source data are provided as a Source Data file.

