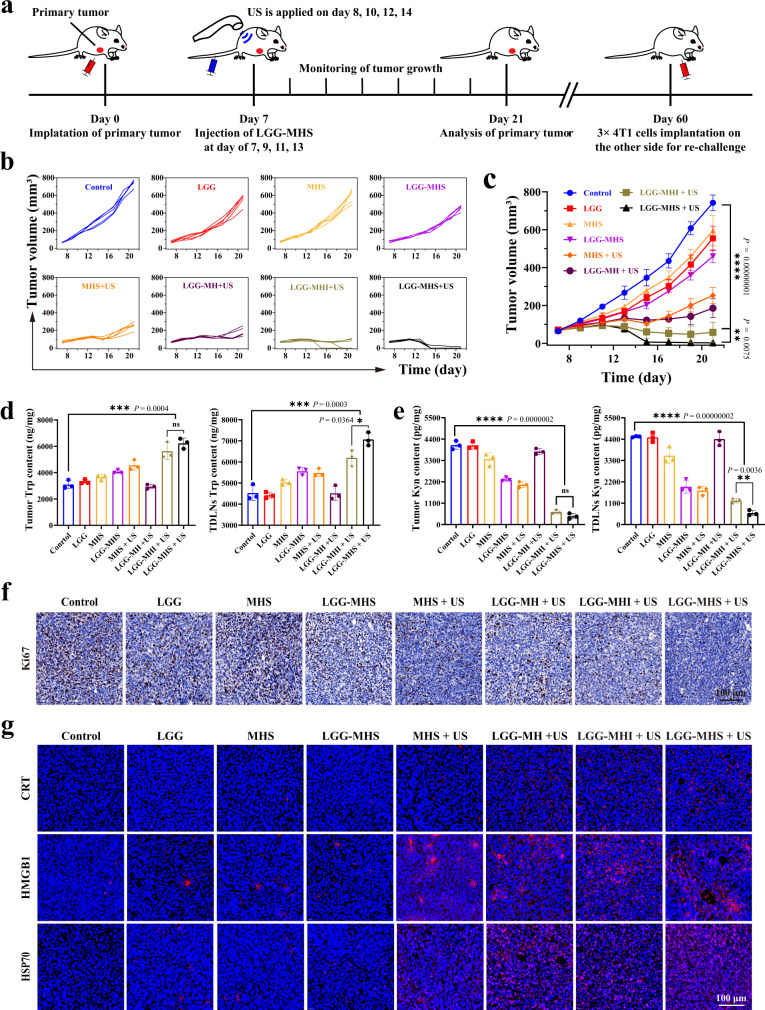
Fig. 6. LGG-MHS + US against 4T1 tumor in vivo.
a Schematic diagram of primary tumor treatment process in vivo. b Tumor growth curves of 4T1 after being treated by PBS, LGG, MHS, LGG-MHS, MHS + US, LGG-MH + US, LGG-MHI + US, and LGG-MHS + US (n = 5 mice per group). c Average tumor growth curves in different groups (n = 5 mice per group). Statistical differences were calculated using two-way ANOVA with the Geisser-Greehouse correction, match values are stacked into a subcolumn. d HPLC assay of the Trp content in primary tumors and TDLNs of tumor-bearing mice after different treatments (n = 3 biologically independent samples). e Elisa assay Kyn content in primary tumors and TDLNs of tumor-bearing mice after different treatments (n = 3 biologically independent samples). f Antigen Ki-67 staining in tumor sections from each experiment group. g Immunofluorescence images of specific proteins expression after DAMPs (HMGB1, CRT, and HSP70) from tumor tissue. DAPI was used to stain the nucleus of the cell (blue). A representative image of three biologically independent samples from each group is shown in f and g. Statistical differences for d and e were calculated using two-tailed unpaired Student’s t-test between two groups, Dunnett’s multiple comparisons post-test for comparisons more than two groups containing group Control. Data were expressed as means ± SD in c, d, and e. *P < 0.05, **P < 0.01, ***P < 0.001, ****P < 0.0001. Source data are provided as a Source Data file.

