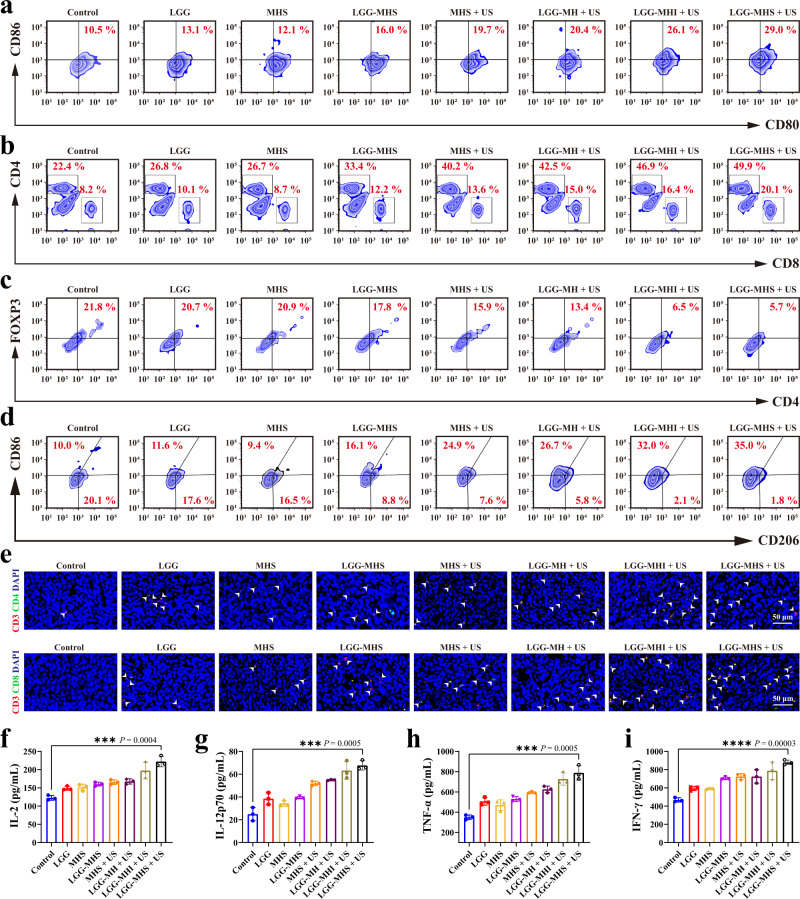
Fig. 7. Reprograming of the tumor immunosuppressive microenvironment by the self-driven LGG-MHS + US nanosystem.
a Typical flow cytometric of mature DCs in tumor tissue after 24 h after the first different treatments. b Typical flow cytometric of T cells of CD4+ and CD8+ T cells in the spleen after 24 h after the first different treatments. c Typical flow cytometric of Tregs in primary tumor tissue after 24 h after the first different treatments. d Representative flow cytometric of M2 macrophages in spleen after 24 h after the first different treatments. e Immunofluorescence images of helper T lymphocytes (CD3+CD4+) and proliferated cytotoxic T lymphocytes (CD3+CD8+) in primary 4T1 tumor tissue slices. f–i Levels of the IL-2, IL-12p70, IFN-α, and TNF-γ in primary tumor tissues after 24 h after the first different treatments (n = 3 biologically independent samples). Representative plots or images of three biologically independent samples from each group is shown in a, b, c, d, and e. Statistical differences for f, g, h, and i were calculated using two-tailed unpaired Student’s t-test, data were expressed as means ± SD. *P < 0.05, **P < 0.01, ***P < 0.001, ****P < 0.0001. Source data are provided as a Source Data file.

