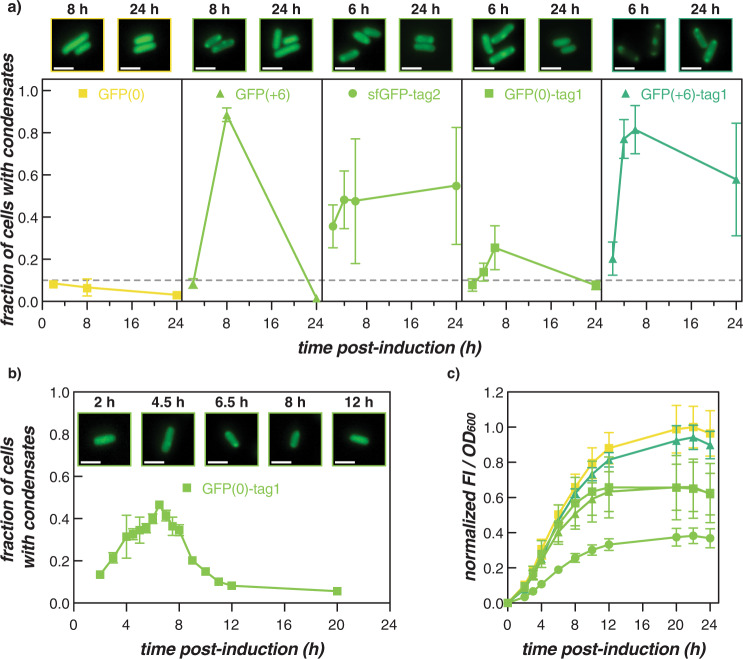
Fig. 3. Changing GFP concentration allows for reversible intracellular phase separation.
a The fraction of cells with condensates was monitored over time for select GFP variants. Interestingly, GFP(+6) and GFP(0)-tag1 form condensates at 6–8 h, but not at earlier or later time points, suggesting that intracellular phase separation of supercationic GFP is reversible. b Condensate formation and disassembly in cells expressing GFP(0)-tag1 monitored for 20 h after induction. The maximum fraction of cells with condensates was observed at 6.5 h post-induction, after which condensates fully disassembled at 12 h. Representative microscopy images of cells at the indicated time post-induction are provided (in a and b). Scale bars are 2 µm. c The ratio of GFP fluorescence intensity to cell density was used as a proxy for intracellular GFP concentration. Intracellular concentrations of GFP(+6) and GFP(0)-tag1 over time follow a similar trend that is distinct from the other GFP variants shown. The average and standard deviation of three biological replicates are plotted for each GFP variant. The symbols and colors used are the same as for a. Circles indicate sfGFP variants, squares indicate GFP(0) variants, and triangles indicate GFP(+6) variants; 0 net charge (yellow), +6 net charge (light green), +12 net charge (green). Individual biological replicates of the variants shown in parts (a) and (c) can be found in Supplementary Figs. 9, 10, and 12.

