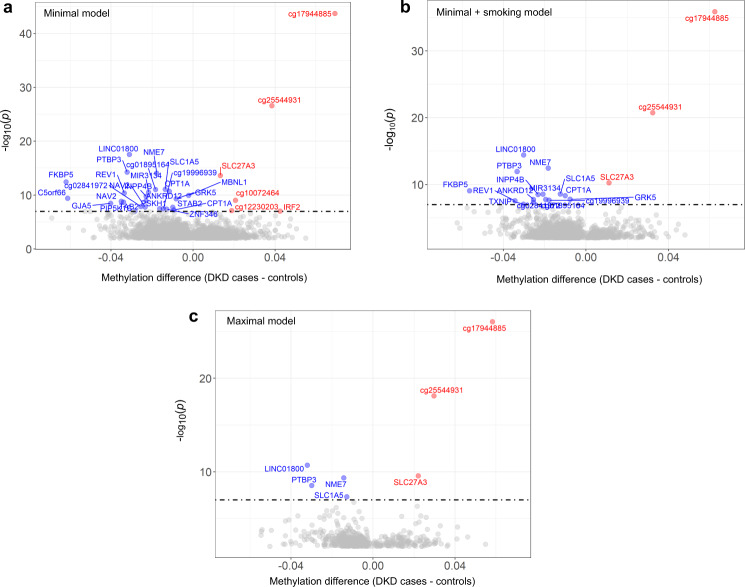
Fig. 3. Volcano plot of methylation differences for CpGs (DKD cases vs controls without DKD) in the meta-analyses of the minimal model (a), minimal model + smoking (b), and maximal model (c).
The red colour denotes differentially methylated CpGs with p < 9.9 × 10⁻⁸ and hypermethylated in DKD cases vs controls and the blue colour denotes differentially methylated CpGs with p < 9.9 × 10⁻⁸ and hypomethylated in DKD cases vs controls. The dotted line indicates the epigenome-wide significance threshold (p ≤ 9.9 × 10⁻⁸). The x-axis shows the mean methylation difference (=mean methylation β-values in DKD cases—mean methylation β-values in DKD controls) and the y-axis shows −log10(p-values). P-values were from the meta-analysis, which combined FDR-adjusted p-values from the individual EWASs with p-values derived from hierarchical linear models. Minimal model included covariates age, sex and six white cell counts. Minimal + smoking model included covariates age, sex, six WCCs and current smoking status. Maximal model included covariates age, sex, six WCCs, current smoking status, HbA1c, HDL cholesterol, triglycerides, duration of diabetes and body mass index.

